Disabling or Enabling Analytics throws Configuration change could not be saved, check your connection with the server
Platform Notice: Data Center Only - This article only applies to Atlassian apps on the Data Center platform.
Note that this KB was created for the Data Center version of the product. Data Center KBs for non-Data-Center-specific features may also work for Server versions of the product, however they have not been tested. Support for Server* products ended on February 15th 2024. If you are running a Server product, you can visit the Atlassian Server end of support announcement to review your migration options.
*Except Fisheye and Crucible
Summary
Problem
When attempting to disable or enable the Analytics plugin on an Atlassian product results in the following error is thrown on the UI:
Configuration change could not be saved, check your connection with the server.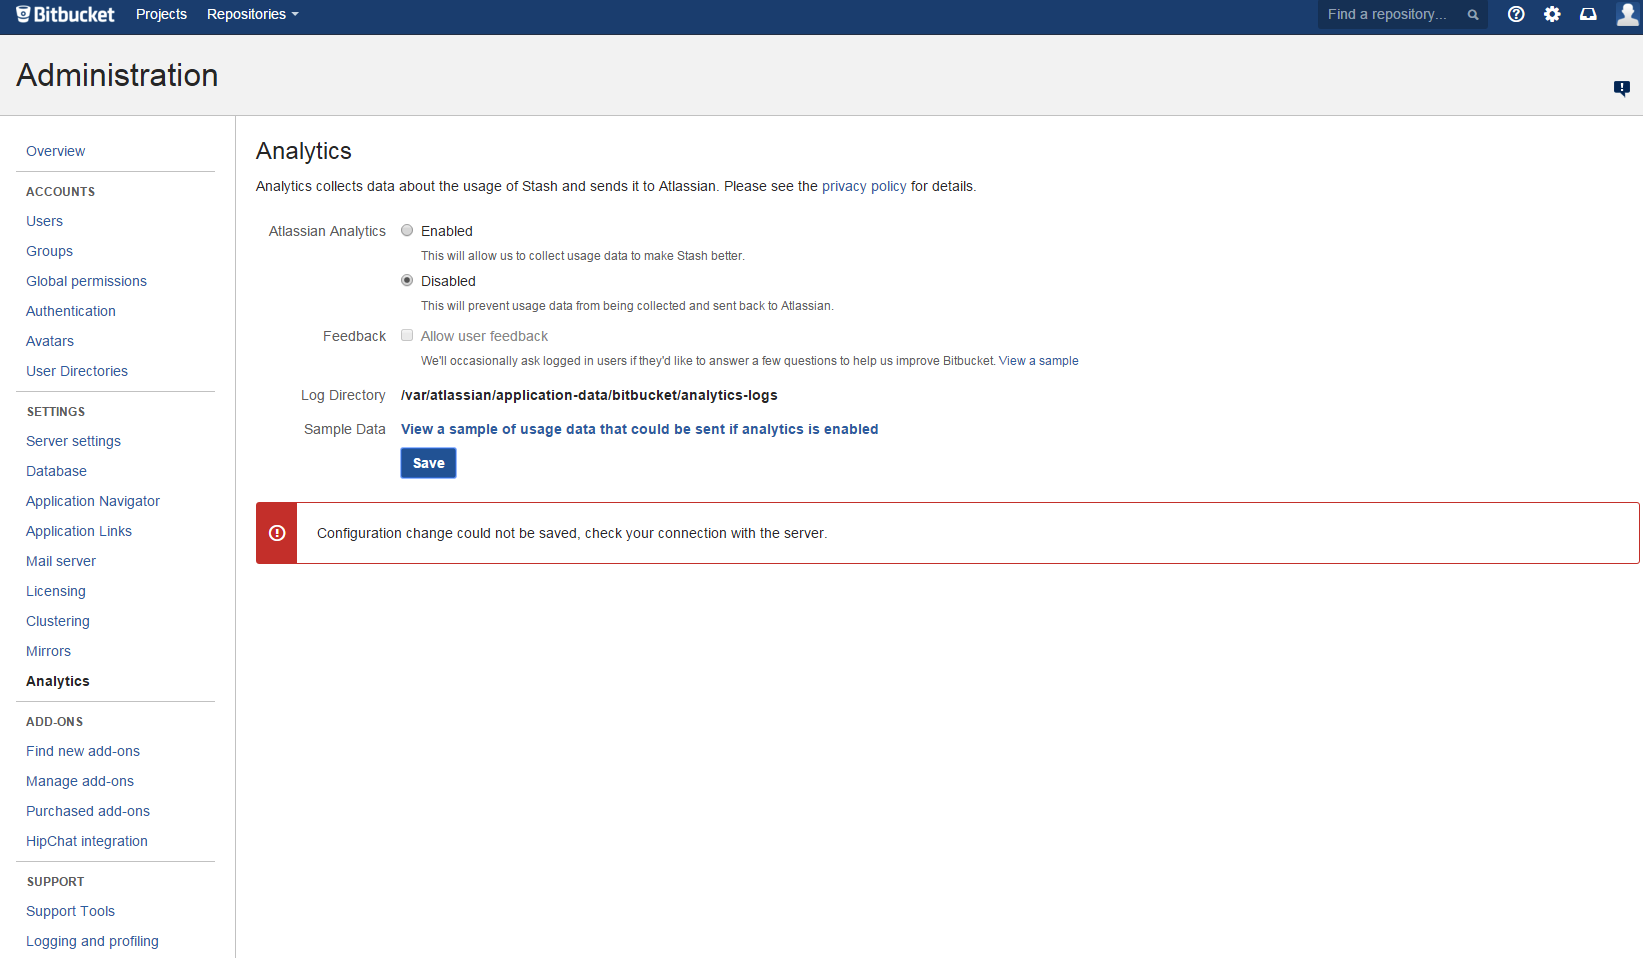
No error raised in the application logs.
Diagnosis
Environment
We were able to replicate this by installing AdBlock on a Chrome browser and configuring it by going to AdBlock options > Filter Lists > Other Filter Lists, and enabling "EasyPrivacy (privacy protection)".
Diagnostic Steps
When you click "Enable" and then save on the screen above, there is a request being sent to a REST endpoint (i.e. on Bitbucket Server). The analysis below can be obtained from the "Network" tab of the "developer tool" of your browser. Refer to Generate a HAR file for more details on how to get there.

The error displayed above is caused by a JavaScript error. That's why there is nothing in the application server logs - the request doesn't make it to the server and the page errors that out.
From the Developer Tools of your browser, you can see that by doing these calls manually from a client machine you should be able Enable/Disable analytics by using, for example,
cURL:To Enable Analytics:
curl -vvv -H "Content-Type:application/json" -H "Accept:application/json" --user admin:admin -X PUT -d '{"analyticsEnabled": "true"}' http://localhost:7990/rest/analytics/1.0/config/enableTo Disable Analytics:
curl -vvv -H "Content-Type:application/json" -H "Accept:application/json" --user admin:admin -X PUT -d '{"analyticsEnabled": "false"}' http://localhost:7990/rest/analytics/1.0/config/enableIf you were able to successfully enable/disable Analytics by using
cURL, the problem is in your browser.It is likely that if you open an "Incognito Window" on your browser you won't hit the issue as this measure bypasses any browser user-installed add-on.
Cause
The error displayed above is caused by a JavaScript error. That's why there is nothing in the application server logs - the request doesn't make it to the server and the page errors that out. We were able to replicate this by installing AdBlock on a Chrome browser and configuring it by going to AdBlock options > Filter Lists > Other Filter Lists, and enabling "EasyPrivacy (privacy protection)".
Solution
Resolution
Identify and fix the root cause by following the steps above. We've identified that the "AdBlock" (or uBlock, or any Ads blocker extensions) browser add-on may cause this issue.
Was this helpful?