Query progress on an Epic from Atlassian Analytics
Platform Notice: Cloud Only - This article only applies to Atlassian apps on the cloud platform.
Epic issues often have one or more child issues that contribute to the progress of the overall Epic. To query the overall progress of an individual epic in Atlassian Analytics, you’ll need to first query the child issues of the epic. Once the child issues associated to the epic have been captured in a chart, then you can calculate the progress of the epic.
Follow these steps to query the progress of an individual epic:
1. Open the chart editor by creating a new chart or editing an existing chart.
2. In your visual mode query, add the Issue ID, and Issue key columns from the Issue table under “Jira family of products”. Change the aggregation of all columns to Group.
3. Add a filter where the Issue key column from the Issue table equals the key of the parent epic issue that you want data for.
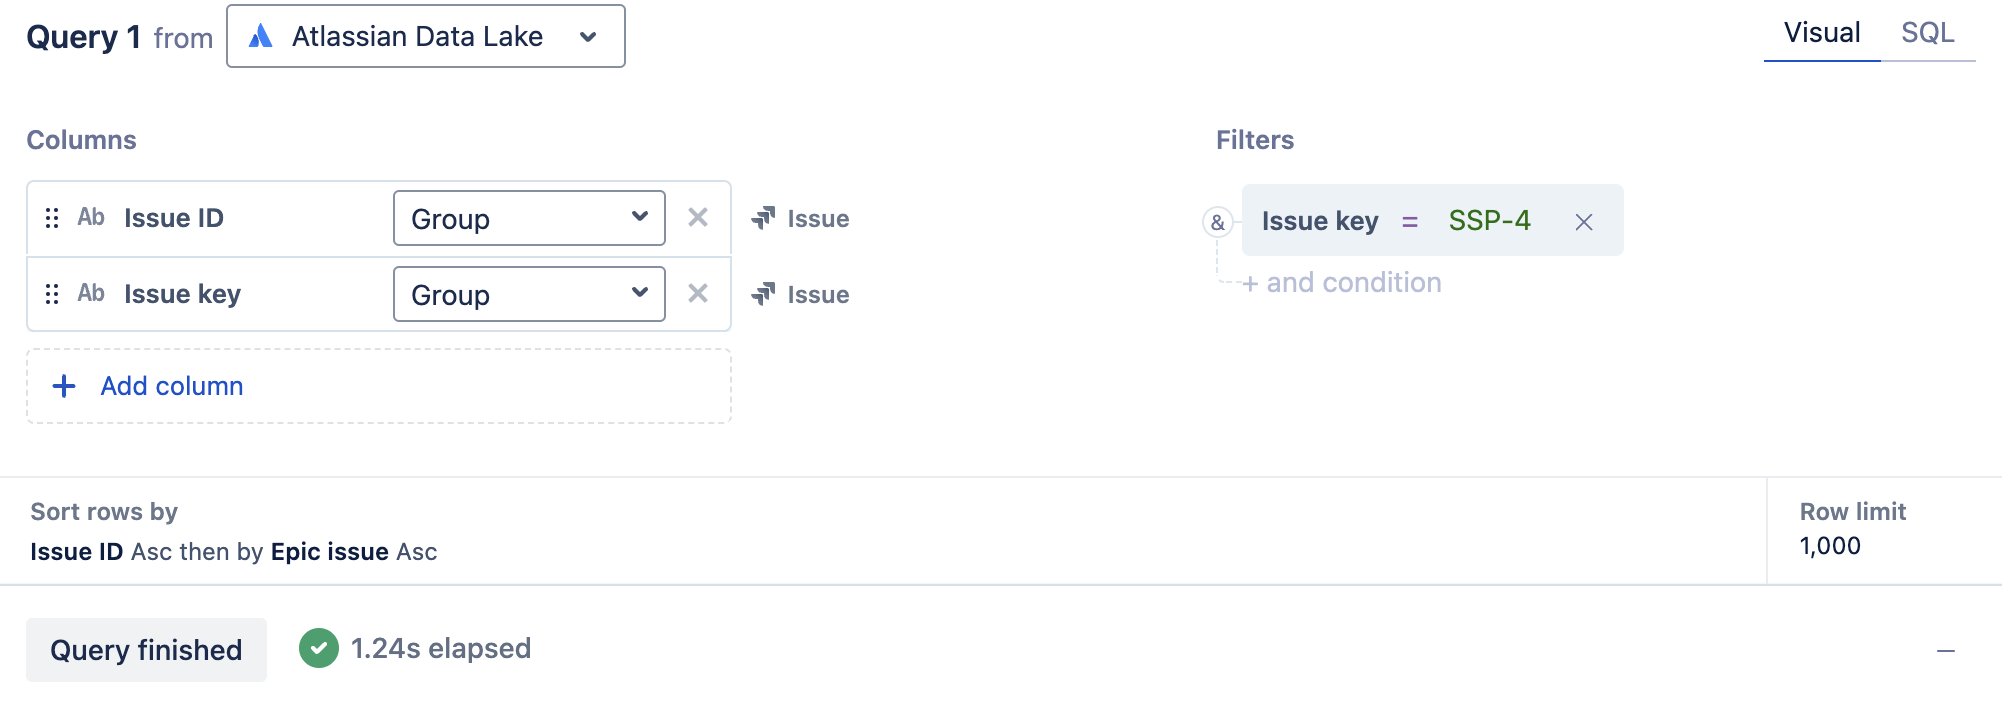
4. Optional: Rename the Issue key column to “Epic issue” for clarity.
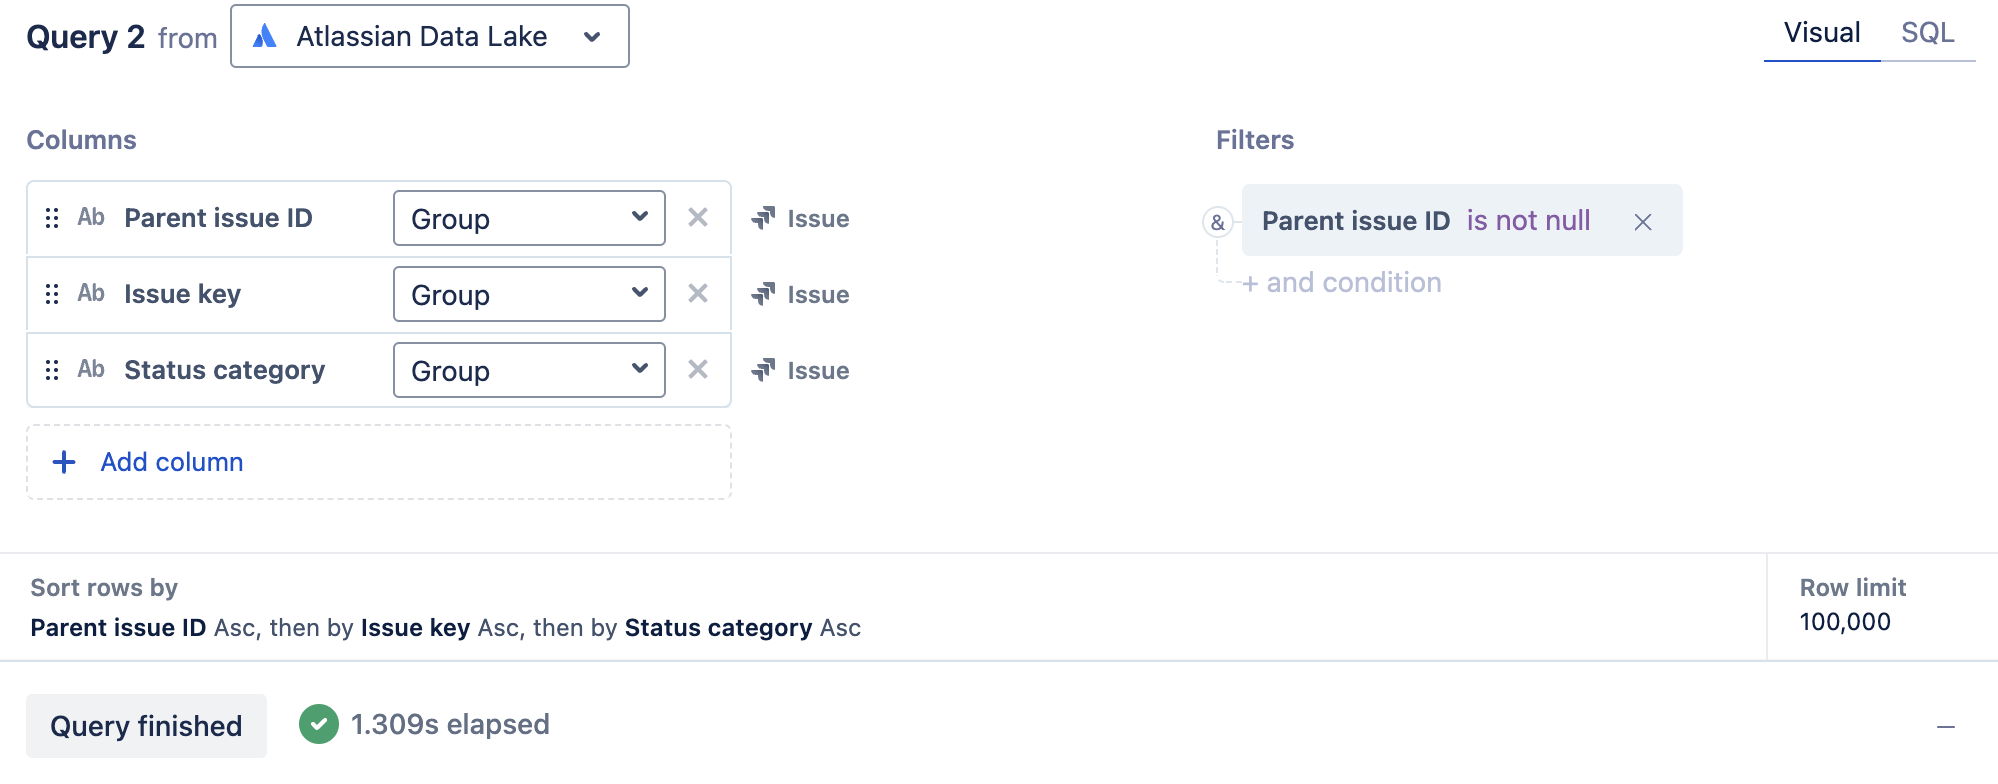
5. Add a second query by selecting Add query and choosing New query.
6. In the new visual mode query, add the Parent issue ID, Issue key, and Status category columns from the Issue table under “Jira family of products”.
7. Add a filter where the Parent issue ID from the Issue table is not null. This returns the values of the parent issues for Jira issues that have a parent issue, with the “Issue key” column being the issue keys of the child issues. Select Run query.
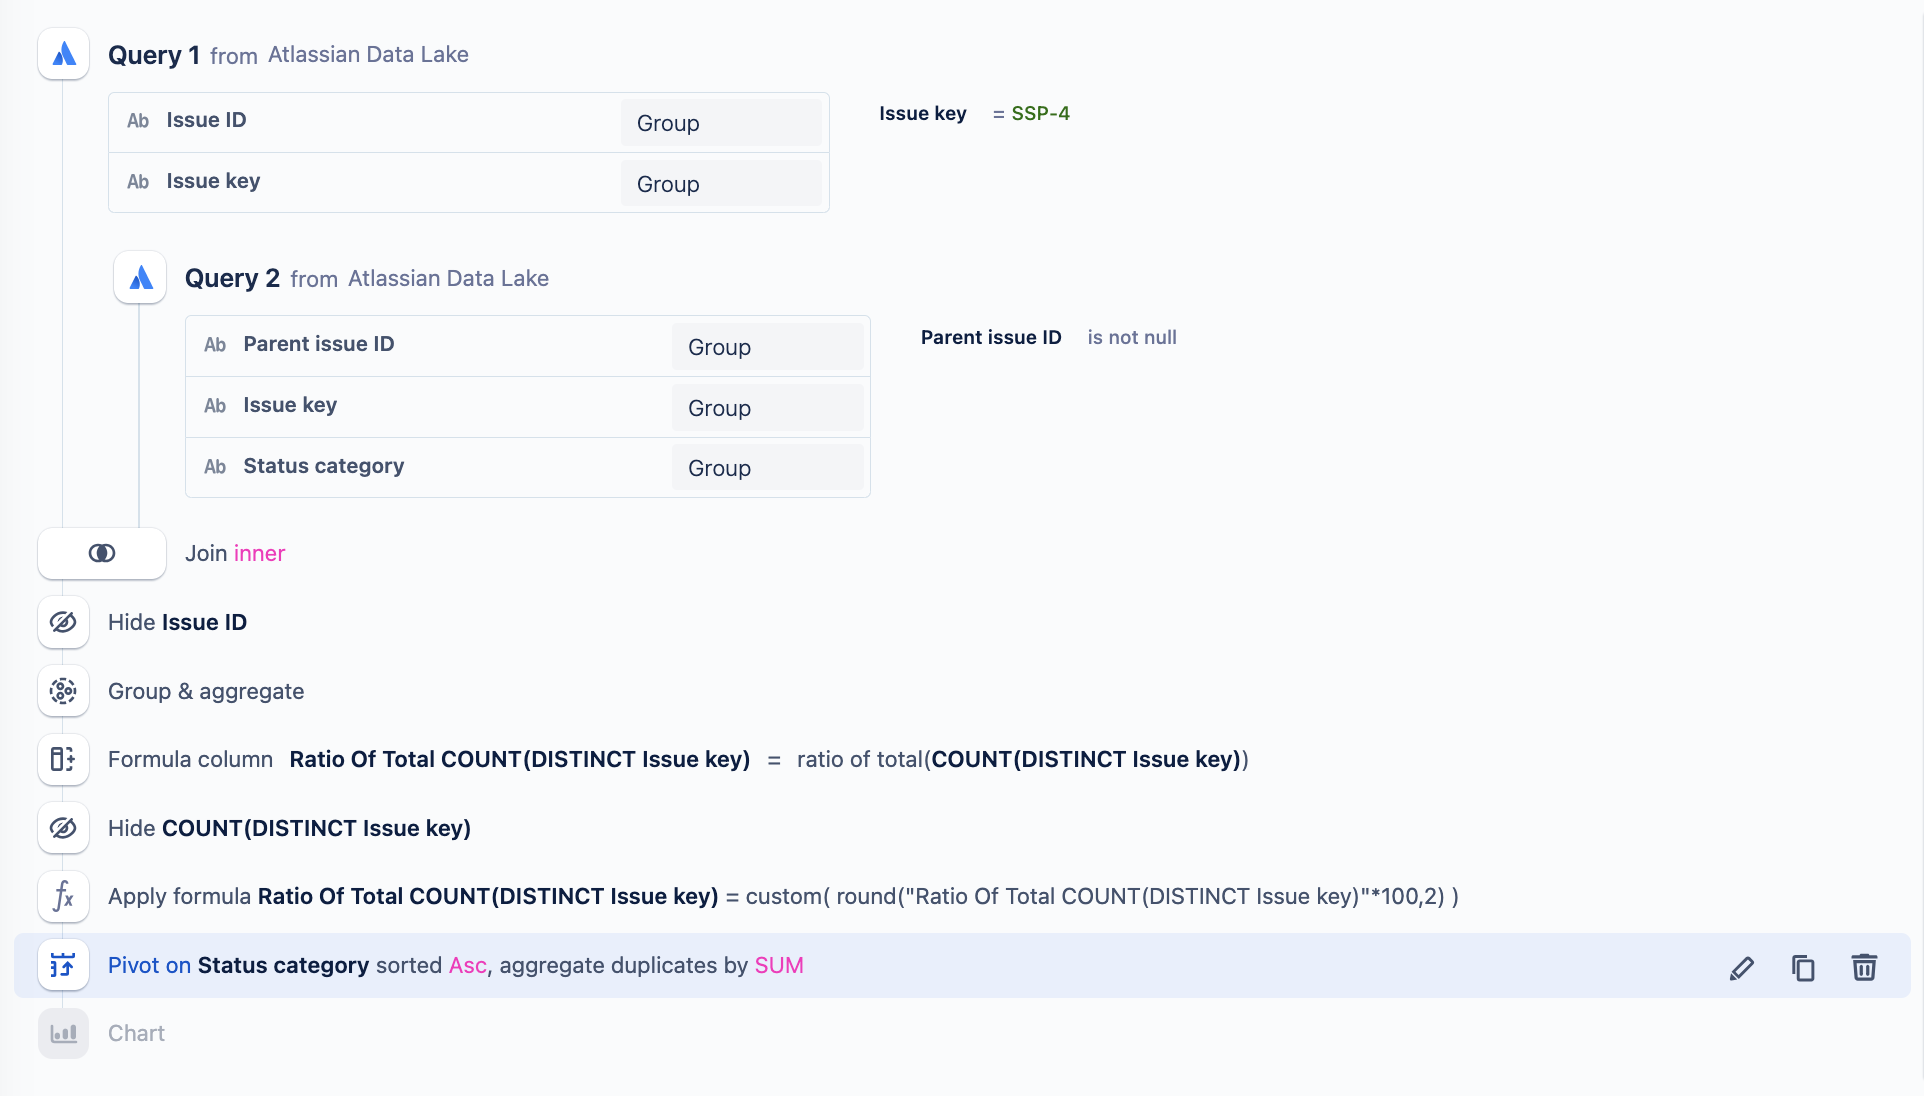
8. Select the “Join” step and change the join type from “Outer” to “Inner”. Doing an inner join filters the results from Query 2 so that only child issues that have a “Parent Issue ID” equal to the “Issue ID” of the selected epic in Query 1 are returned.
Now that the chart is displaying the epic issue and it’s child issues. We can begin modifying the data to calculate the overall progress of the epic based on the current status of the child issues.
Hide the “Issue ID” column.
Add a Group & aggregate step: group the "Epic issue" and "Status category" columns and aggregate the "Issue key" column with a count of unique.
Add a Formula column and select the 'Ratio of total' guided formula. Select the "COUNT(DISTINCT Issue key)" column for the ratio of the total to be calculated.
Hide the "COUNT(DISTINCT Issue key)" column.
Apply a formula to the "Ratio Of Total COUNT(DISTINCT Issue key)" column and use the following custom formula to multiply the column by 100 and round it to 2 decimal points:
round("Ratio Of Total COUNT(DISTINCT Issue key)"*100,2). This will help the percentages be displayed as 10.25% instead of 0.1025.Finally, Pivot the data to have the status categories turned into their own columns with the appropriate completion percentage.
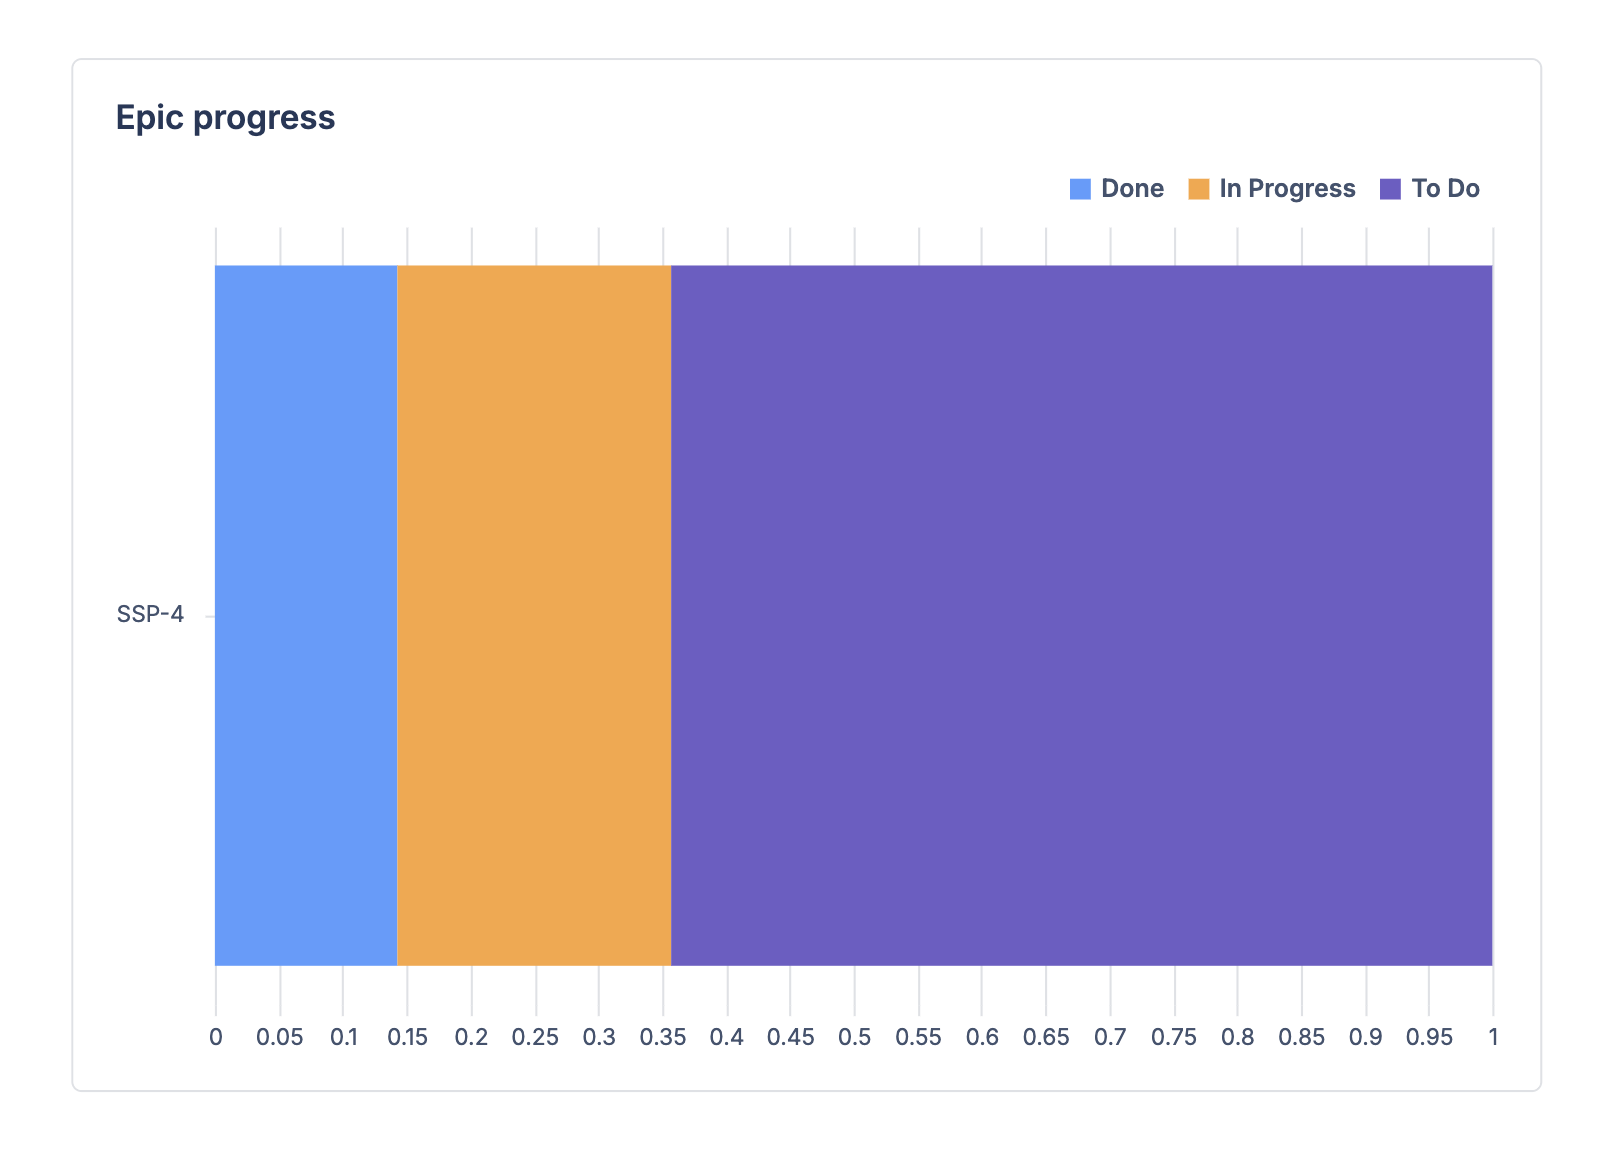
Optional: Change the chart type to a Bar chart and check the ‘Percentage’ and ‘Horizontal’ options within the bar chart settings.
Was this helpful?