Query data from specific sites
Platform Notice: Cloud Only - This article only applies to Atlassian apps on the cloud platform.
Summary
The Atlassian Data Lake gives you access to all app data across your organization, which means you can report on data across different sites.
If you want to query app data from a specific site, you can use the “Workspace” table, which contains information about your sites.
In this example, we want to filter for goals from a specific site. We have an existing chart that shows the total number of off-track goals in our organization, so we’ll go through how to filter for goals in particular sites.
Solution
Create a key-value “Dropdown” control for workspaces
First, we’ll create a “Dropdown” control of key-value pairs, where the keys are workspace IDs and the values are workspace URLs. The values are what will be visible to dashboard viewers when they interact with the control on the dashboard.
Select Control > Dropdown from the dashboard sidebar.
Select Switch to control editor.
Select the Workspace ID and URL columns from the Workspace table. The “Workspace” table contains information about the sites and app instances in your organization.
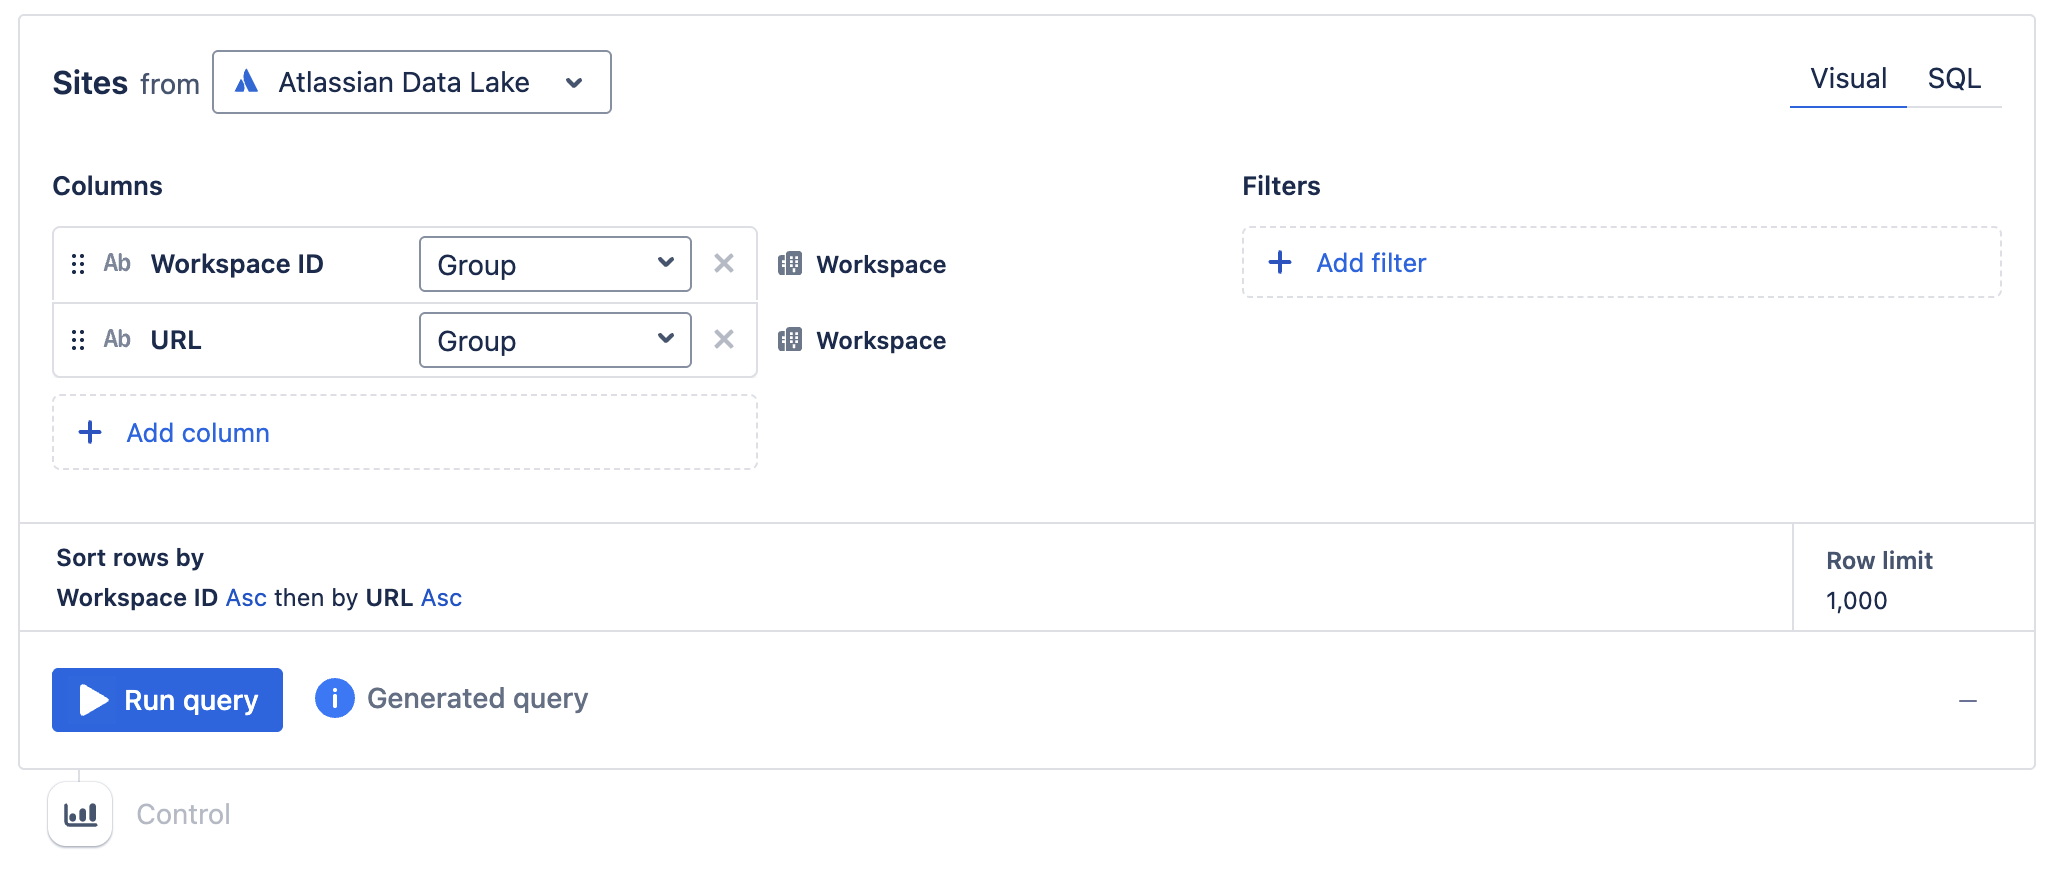
Select Run query.
Optional: Change the variable name of the control to
SITES.Select Multi-select so that dashboard viewers can select more than one site from the list.
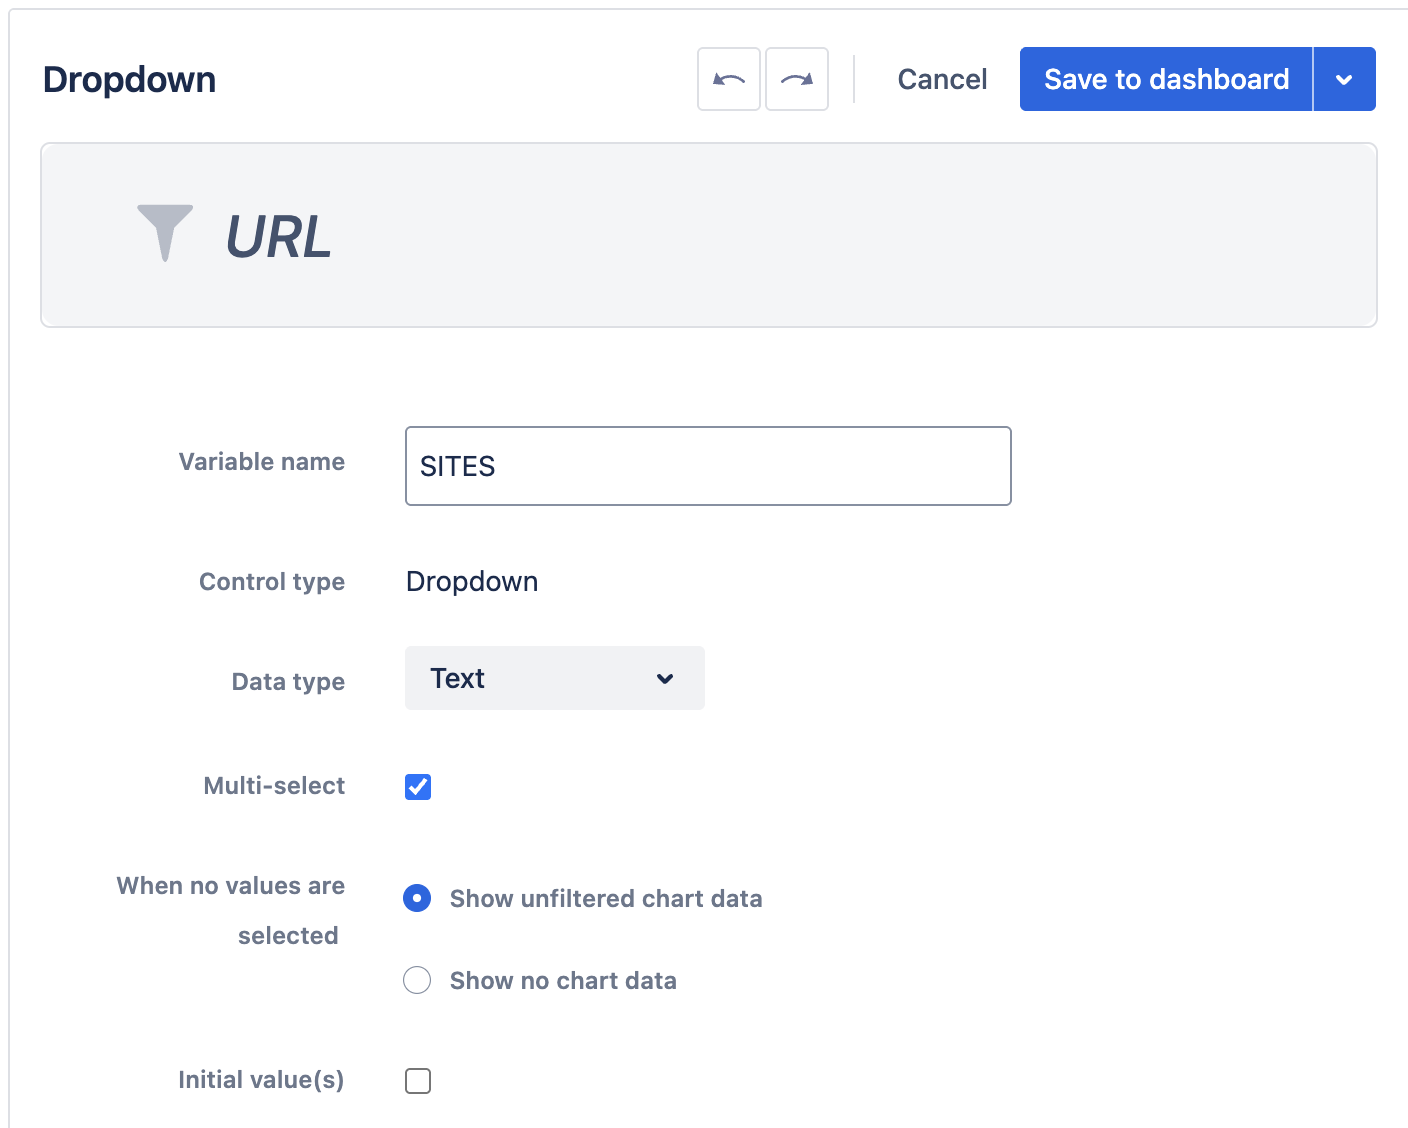
Select Save to dashboard, then place the control where you’d like on the dashboard.
Connect the control to your charts
Once the key-value “Dropdown” control is created, you’ll need to connect it to your charts. For this example, we’ll need to add another query to our existing chart to filter for selected sites.
Edit the chart that you want to filter with the “Dropdown” control.
Edit the query with the data you want to filter and add the Workspace ID column from the table with the data you’re interested in. For our example, which gets data about goals, we’ll add the Workspace ID column from the Goal table.
Reorder the Workspace ID column so it’s the first column in the list. This makes it so that the column will be the leftmost column in the result table.
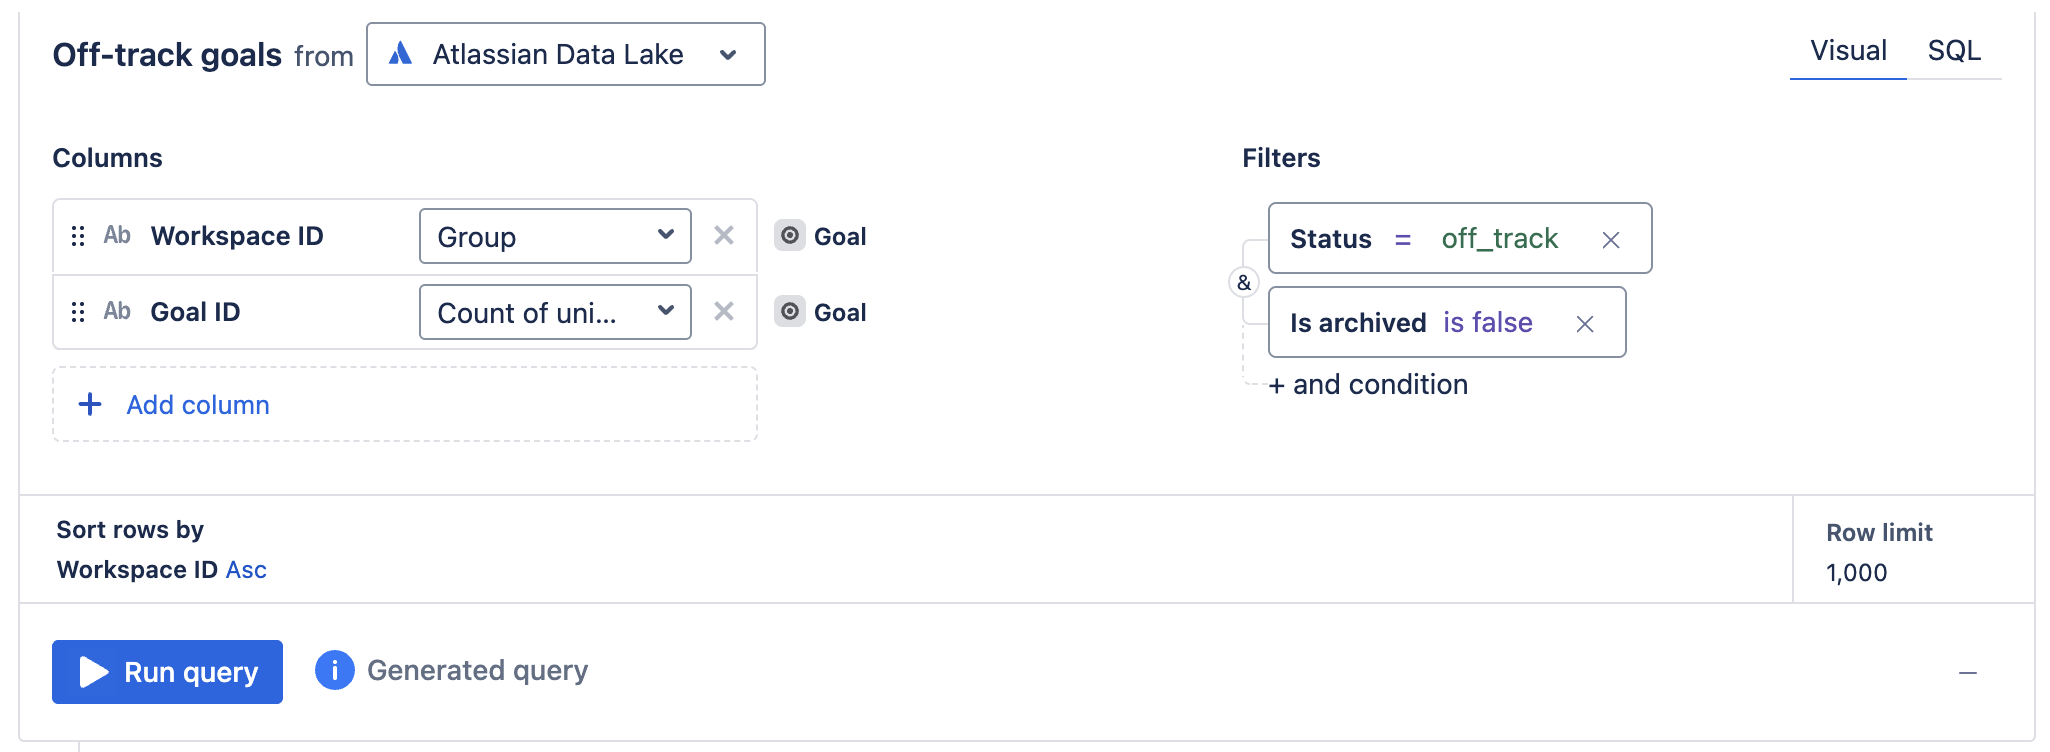
Select Run query.
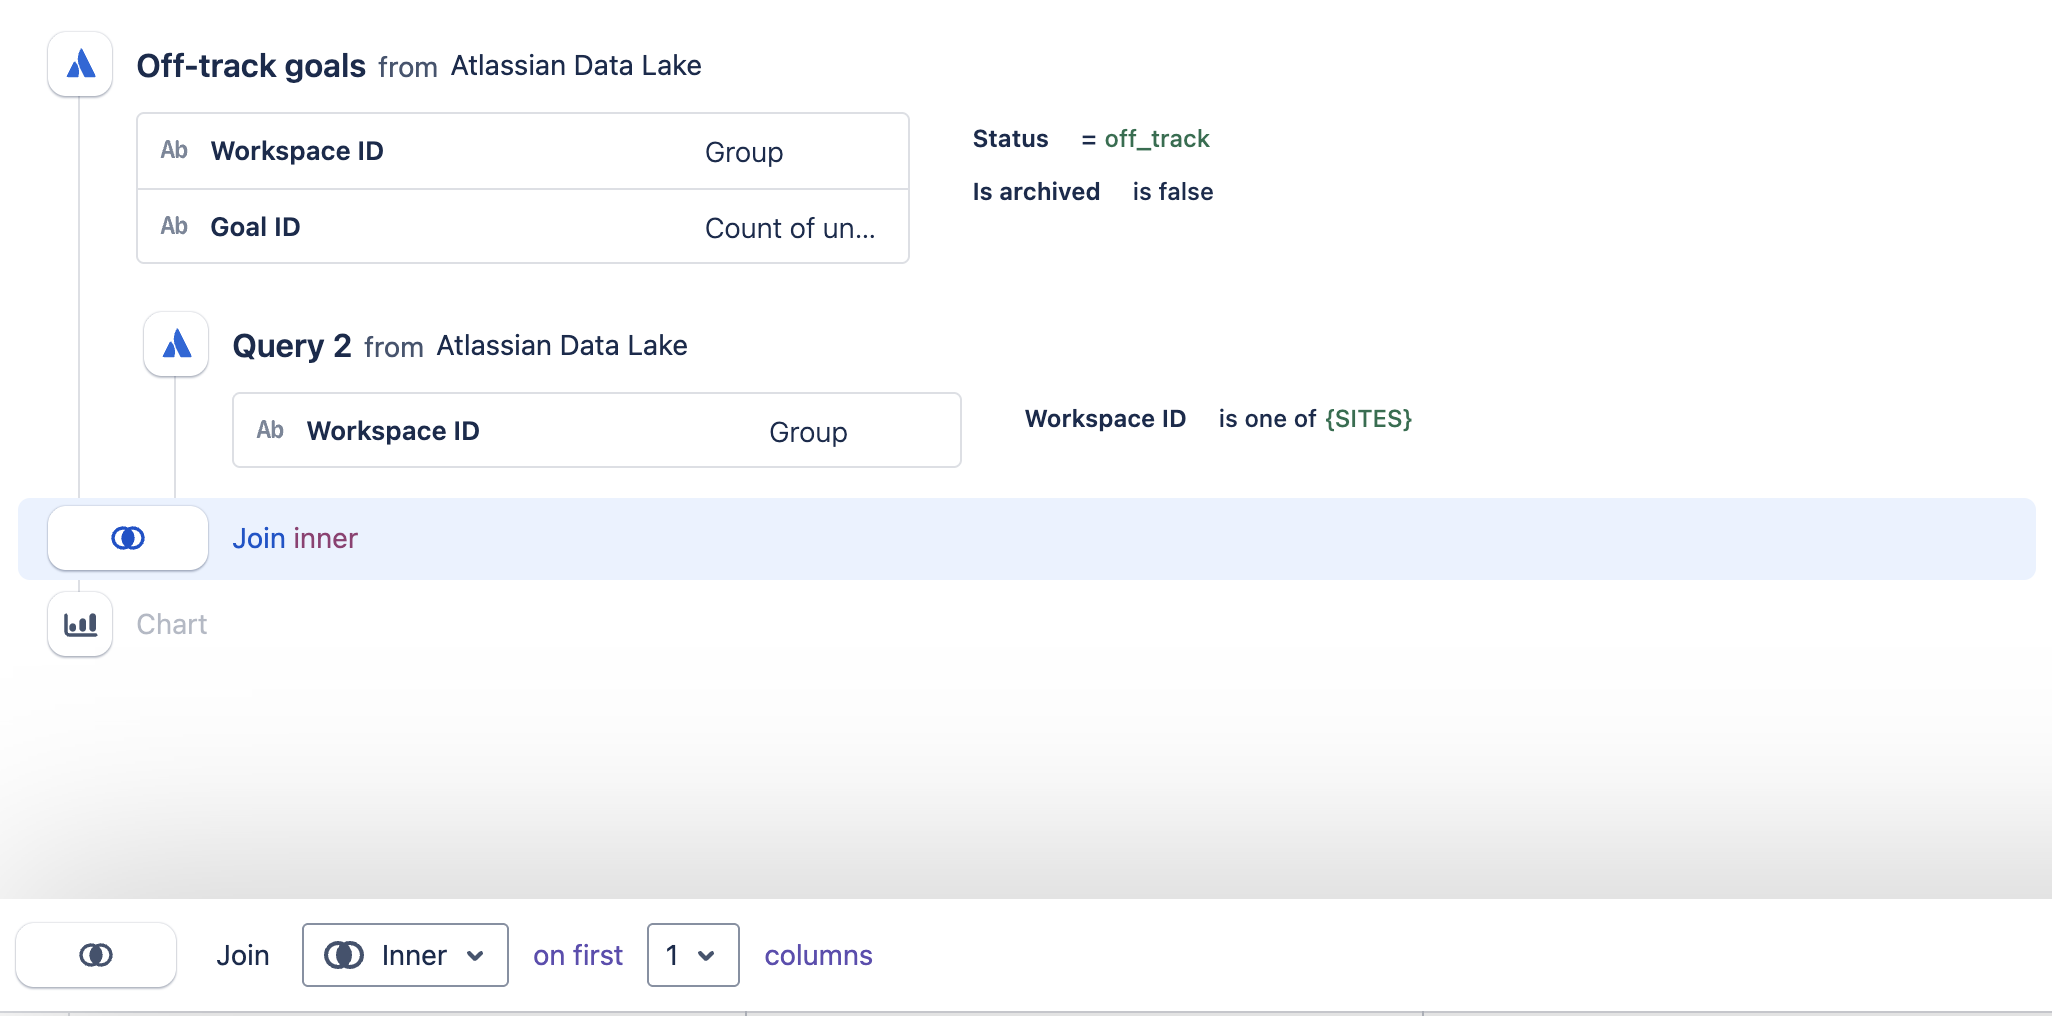
Select Add query > New query. This new query will get data about workspaces.
In the new query, select Add column, then add the Workspace ID column from the Workspace table.
Add a query filter where Workspace ID is one of
{SITES}. Replace{SITES}with the variable name of your “Dropdown” control.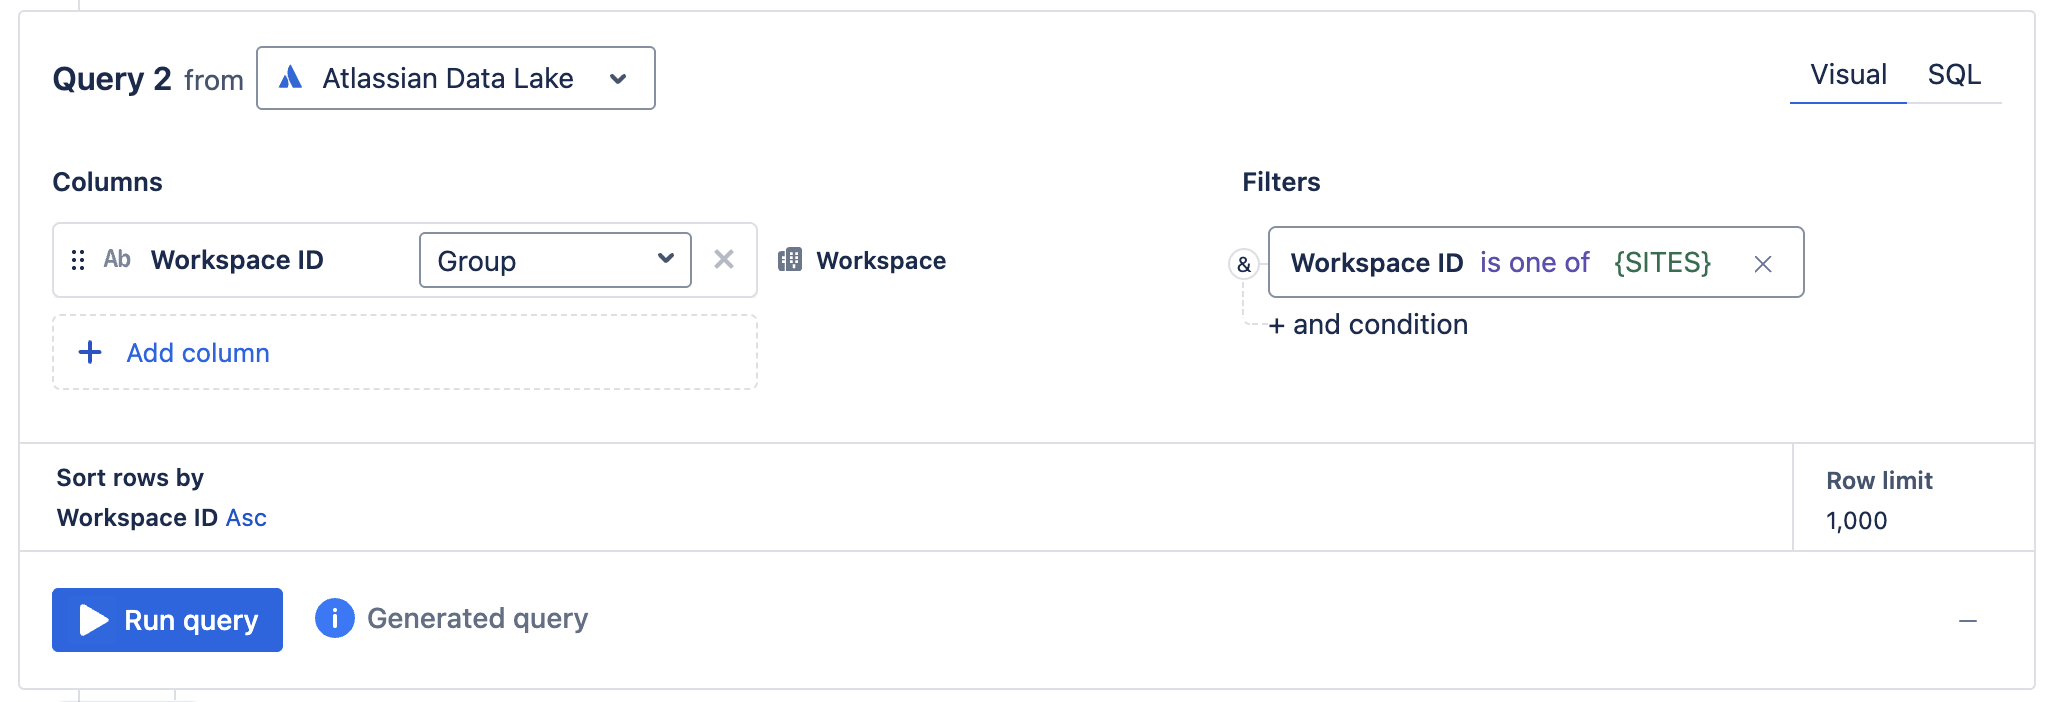
Select Run query.
Edit the Join step so it uses an Inner join on the first 1 column, then select Save.
Hide the Workspace ID column from the final result.
Select Save to dashboard to save the changes to your chart.
Now when you select a site from your “Dropdown” control, it should filter the chart for that particular site’s data.
Was this helpful?