Count distinct totals and percentages
Platform Notice: Cloud Only - This article only applies to Atlassian apps on the cloud platform.
In this example, we create a table chart using our Atlassian Data Lake data source to compare the number of distinct Jira issues per month over the last six months and include the percentage each month’s count contributes to the six-month total.
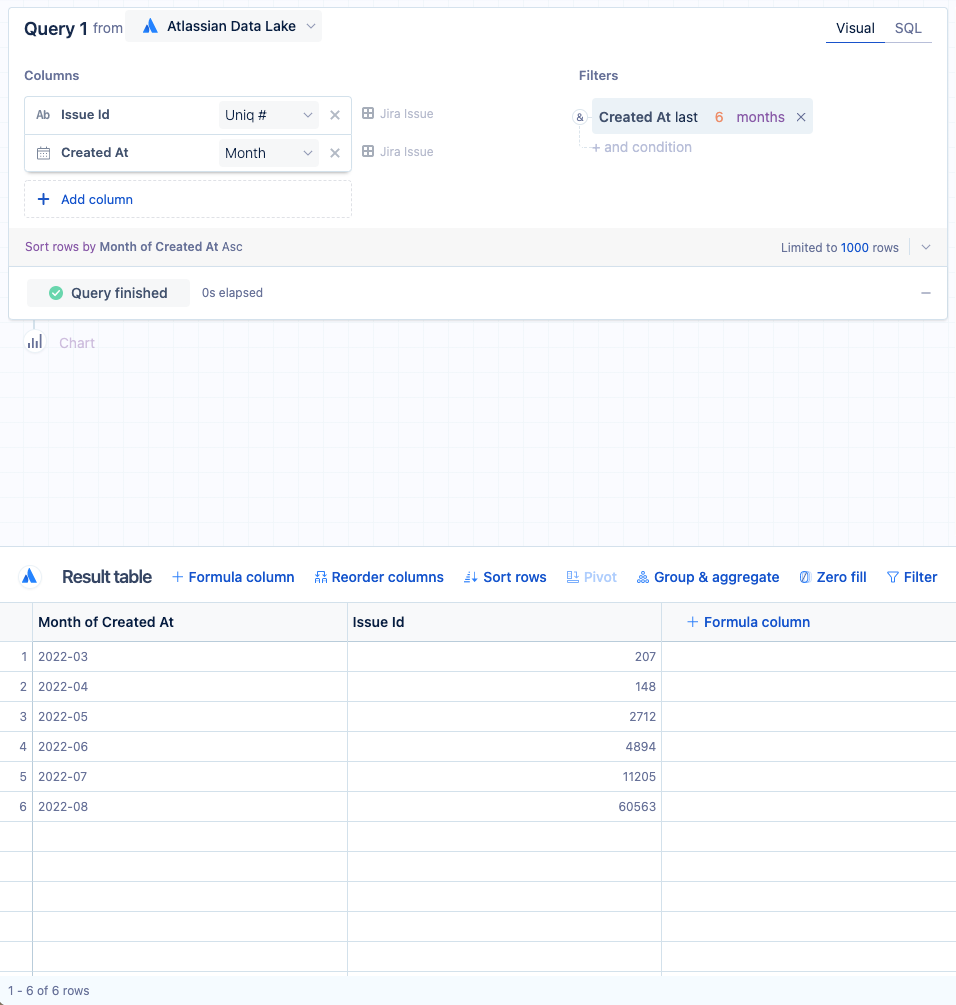
Create the base query:
From the Jira issue table, add the Issue ID and Created at columns to your visual mode query.
Change the time bucket for the “Created At” column to Month.
From the Jira issue table, also add the Created at column to the “Filters” section. To filter for the last six months, select last N interval as the filter operator, set N as 6, and the interval as months.
Select Run query.
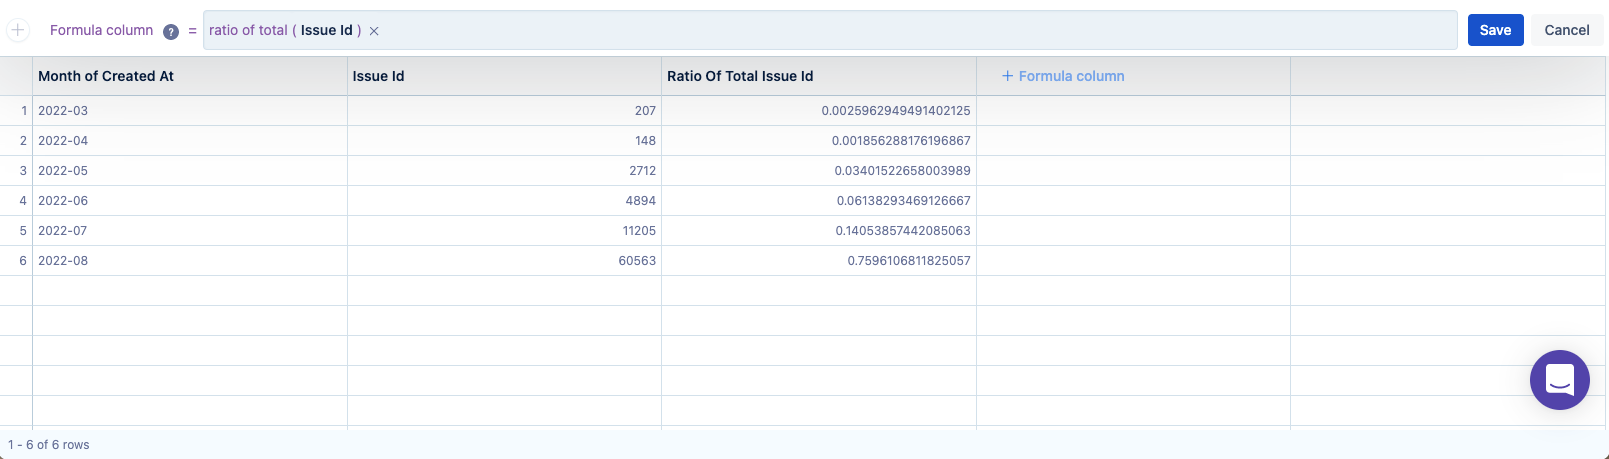
Next, add a “Formula column” step, select Ratio of total from the guided formulas, then select the Issue ID column. Each row in this new column will show how much each month’s issue count contributes to the total six-month issue count.
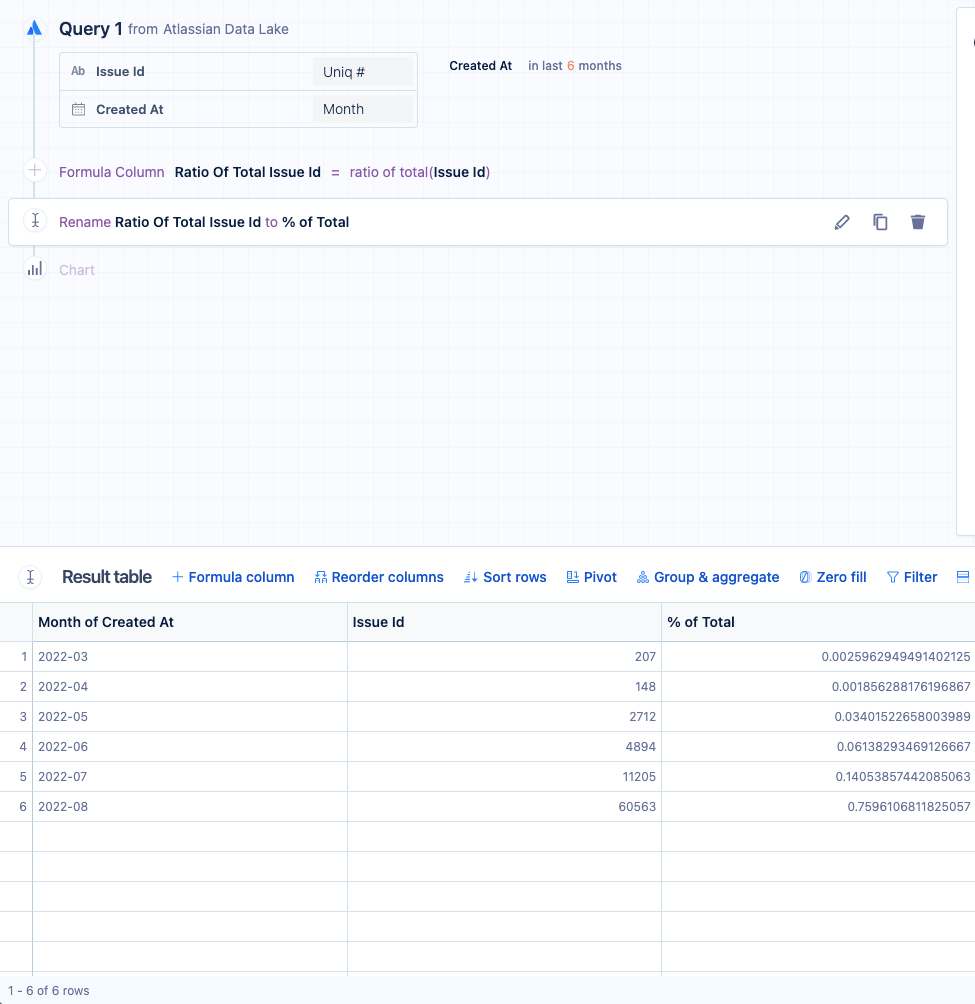
Rename the “Ratio of total issue ID” column to “% of total” for a bit more clarity.
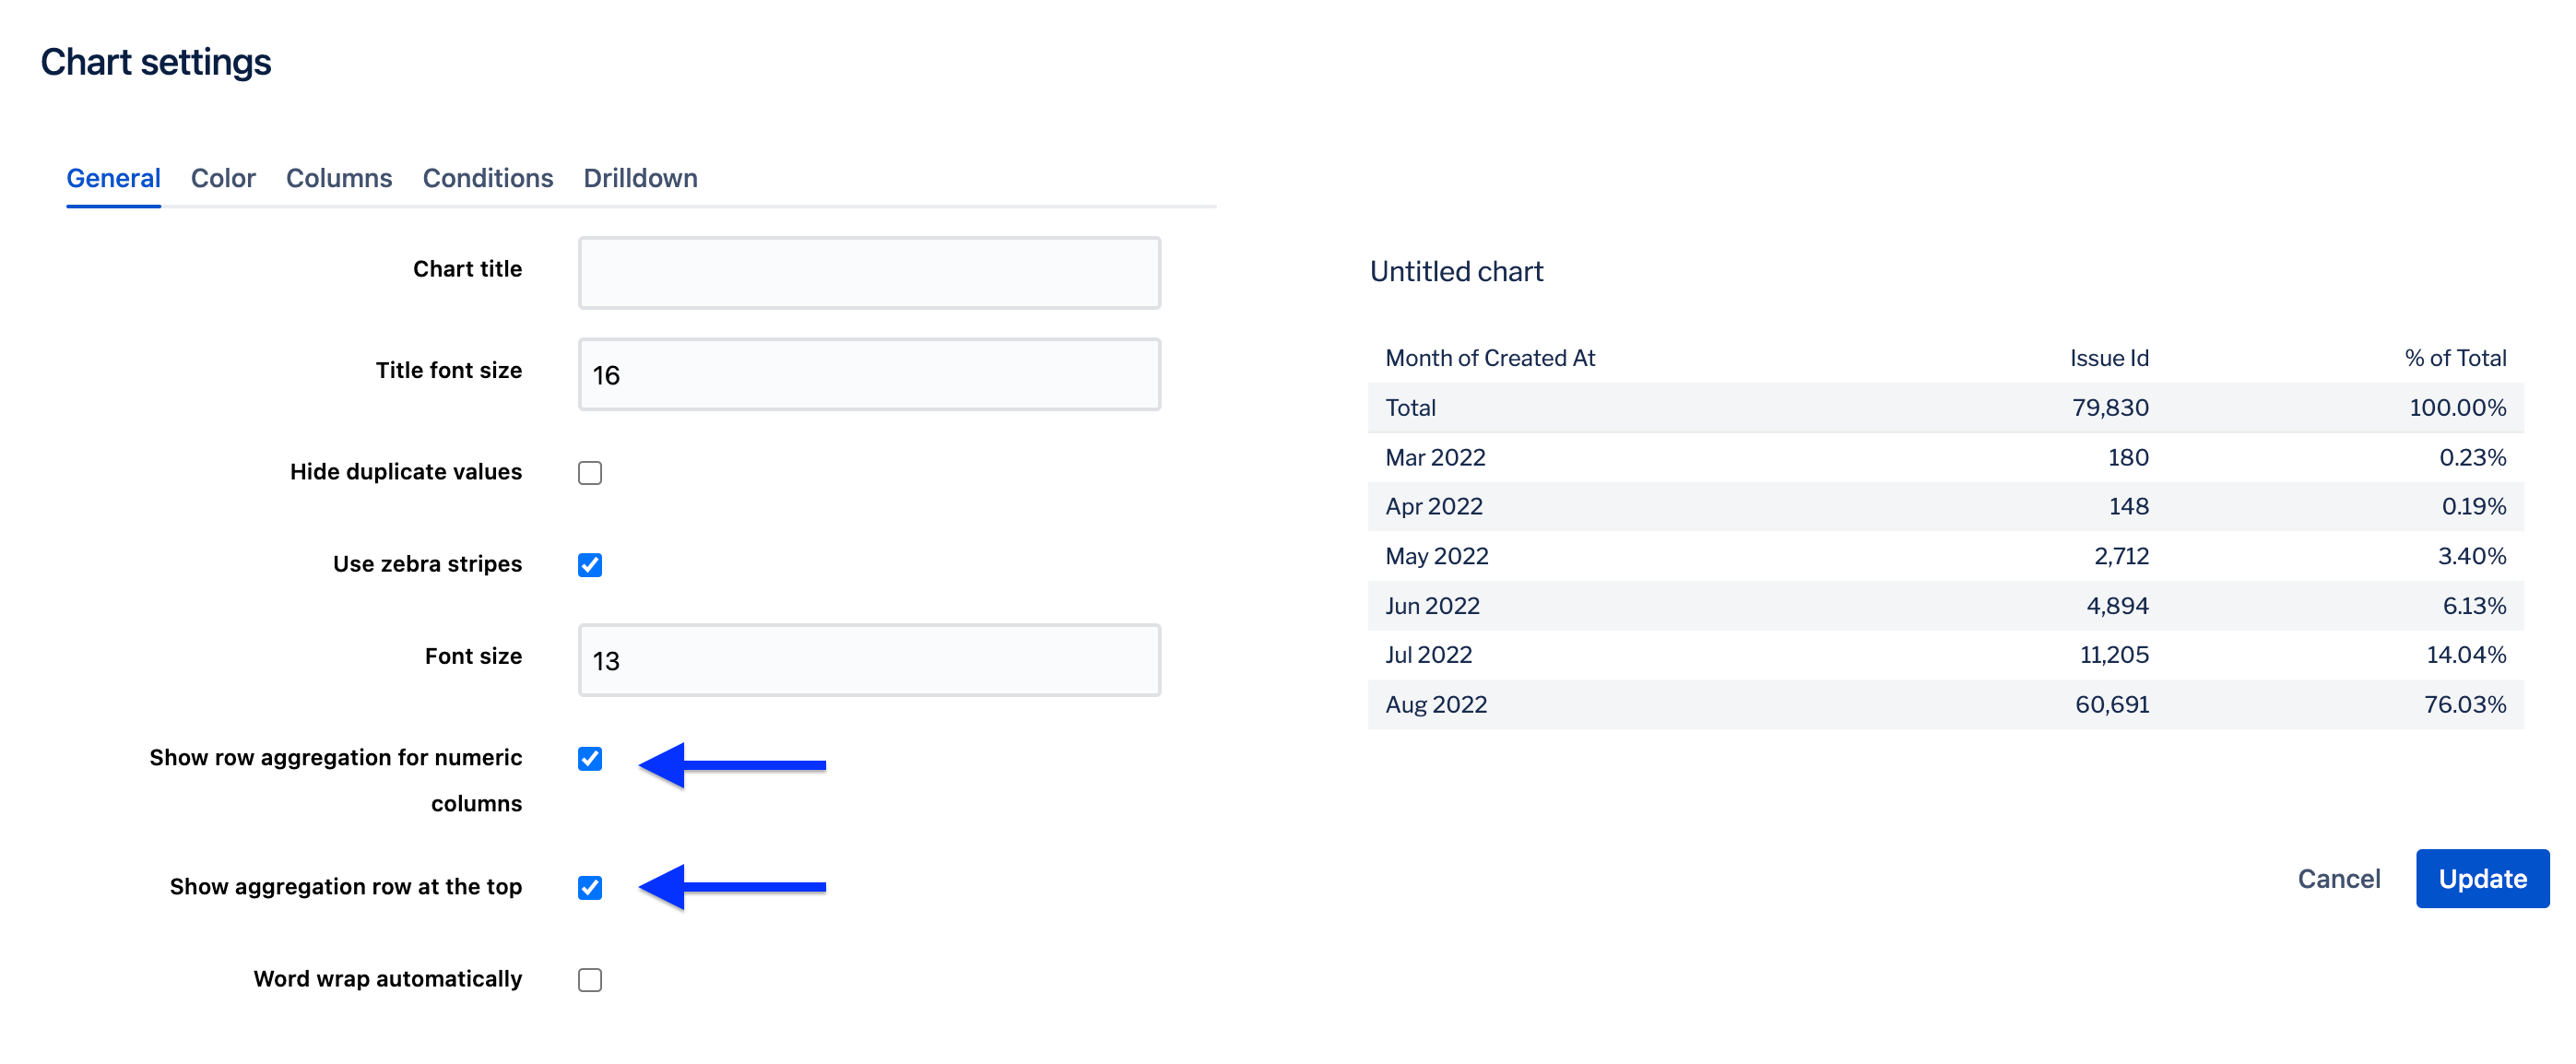
To add the finishing touches to the table chart, open the chart settings by selecting the gear icon located above the chart preview.
If you want to see the total six-month issue count in your table chart, select Show row aggregation for numeric columns from the General tab. By default, the row aggregation is shown as the bottommost row of the table, but you can opt to make it the topmost row by selecting the option Show aggregation row at the top.
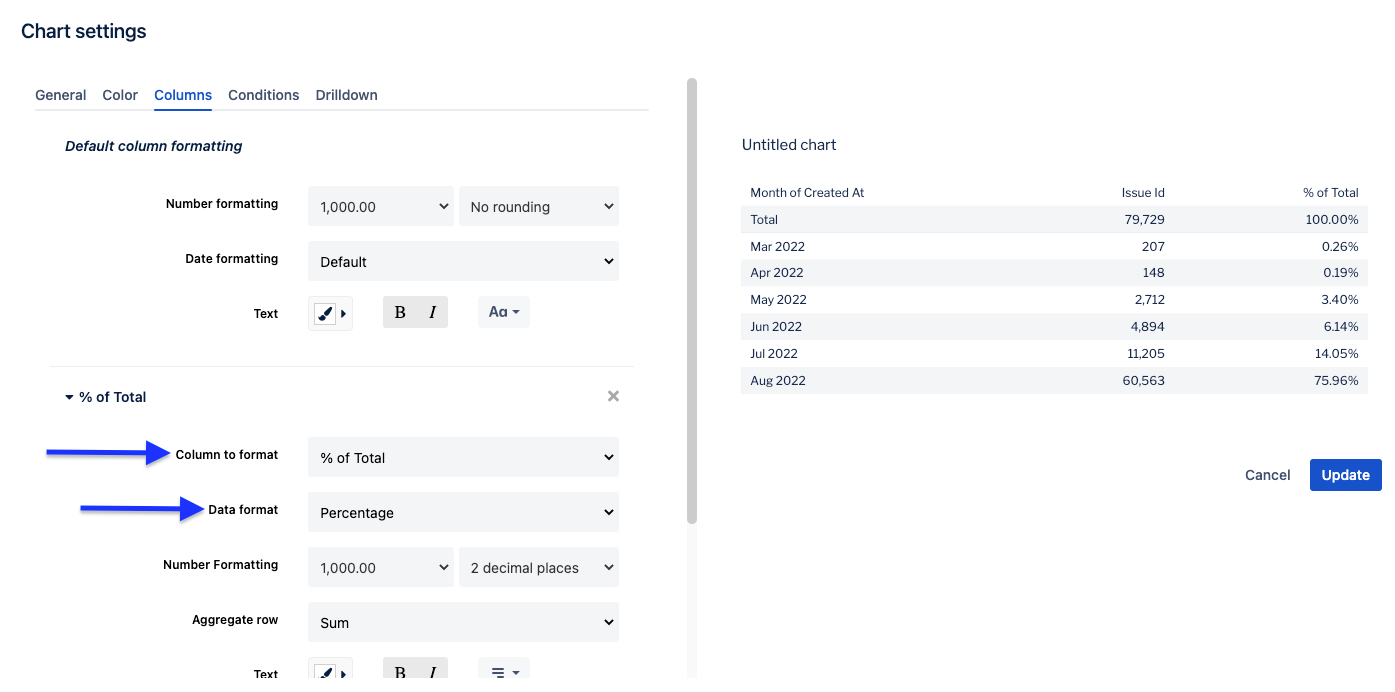
Lastly, you need to make the “% of total” column actually show percentages! Go to the Columns tab and select + Add formatting rule. Select % of total for the column to format and Percentage for the data format. You can change the precision with the Number formatting field; by default, the numbers are rounded to the nearest integer.
Select Update to save your changes and place the chart on your dashboard.
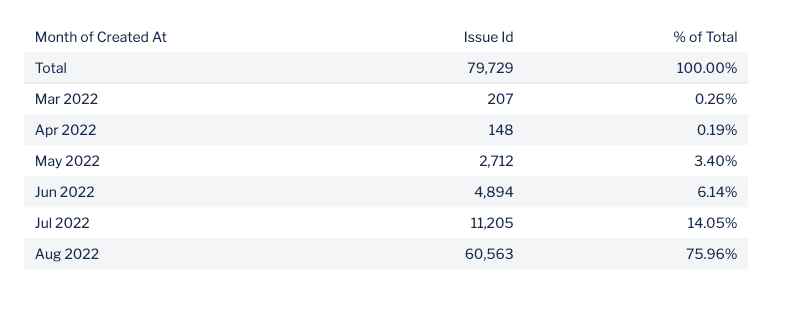
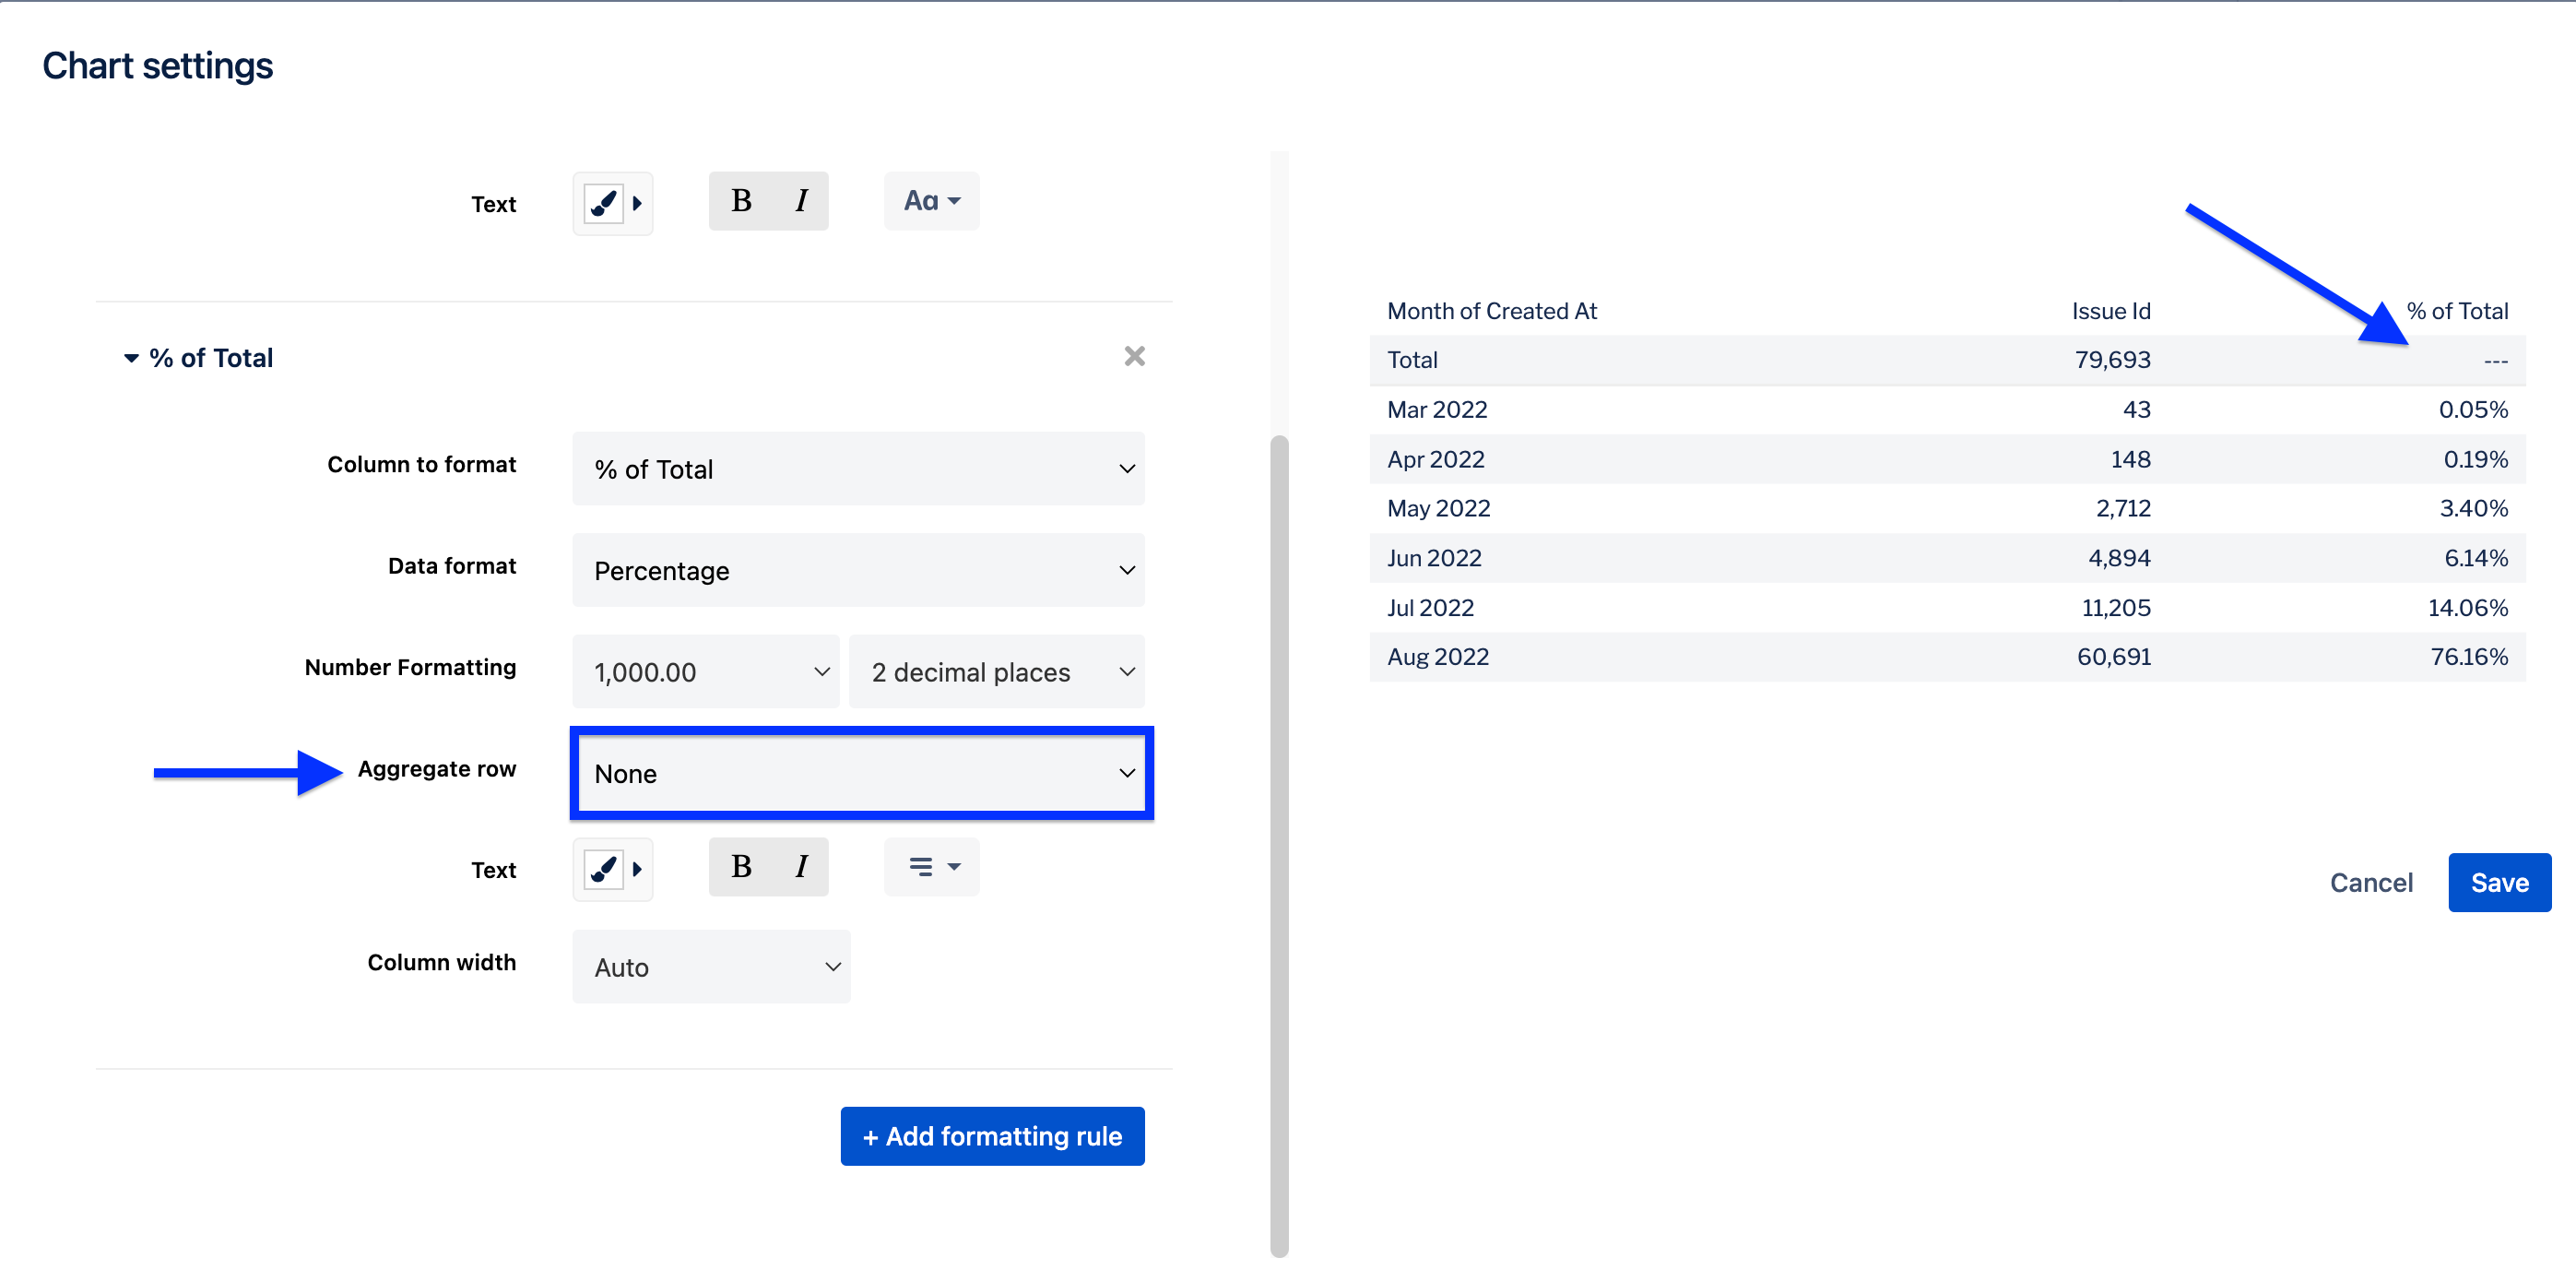
In the final chart above, the total is counted for both the “Issue ID” column and the “% of total” column. You can further adjust the chart settings if you instead only want to show the total sum of issues. To do this, reopen the chart settings and navigate back to the Columns tab. For the “% of total” column, you can update the column formatting by changing the Aggregate row setting from “Sum” to “None”.
Was this helpful?