The Control Chart inaccurately calculates the lead time
Platform Notice: Data Center Only - This article only applies to Atlassian apps on the Data Center platform.
Note that this KB was created for the Data Center version of the product. Data Center KBs for non-Data-Center-specific features may also work for Server versions of the product, however they have not been tested. Support for Server* products ended on February 15th 2024. If you are running a Server product, you can visit the Atlassian Server end of support announcement to review your migration options.
*Except Fisheye and Crucible
Summary
In this article, we will discuss a scenario in which the Control Chart displays incorrect and unrealistic lead times for different user stories. This discrepancy can potentially cause confusion and inaccuracies in project tracking.
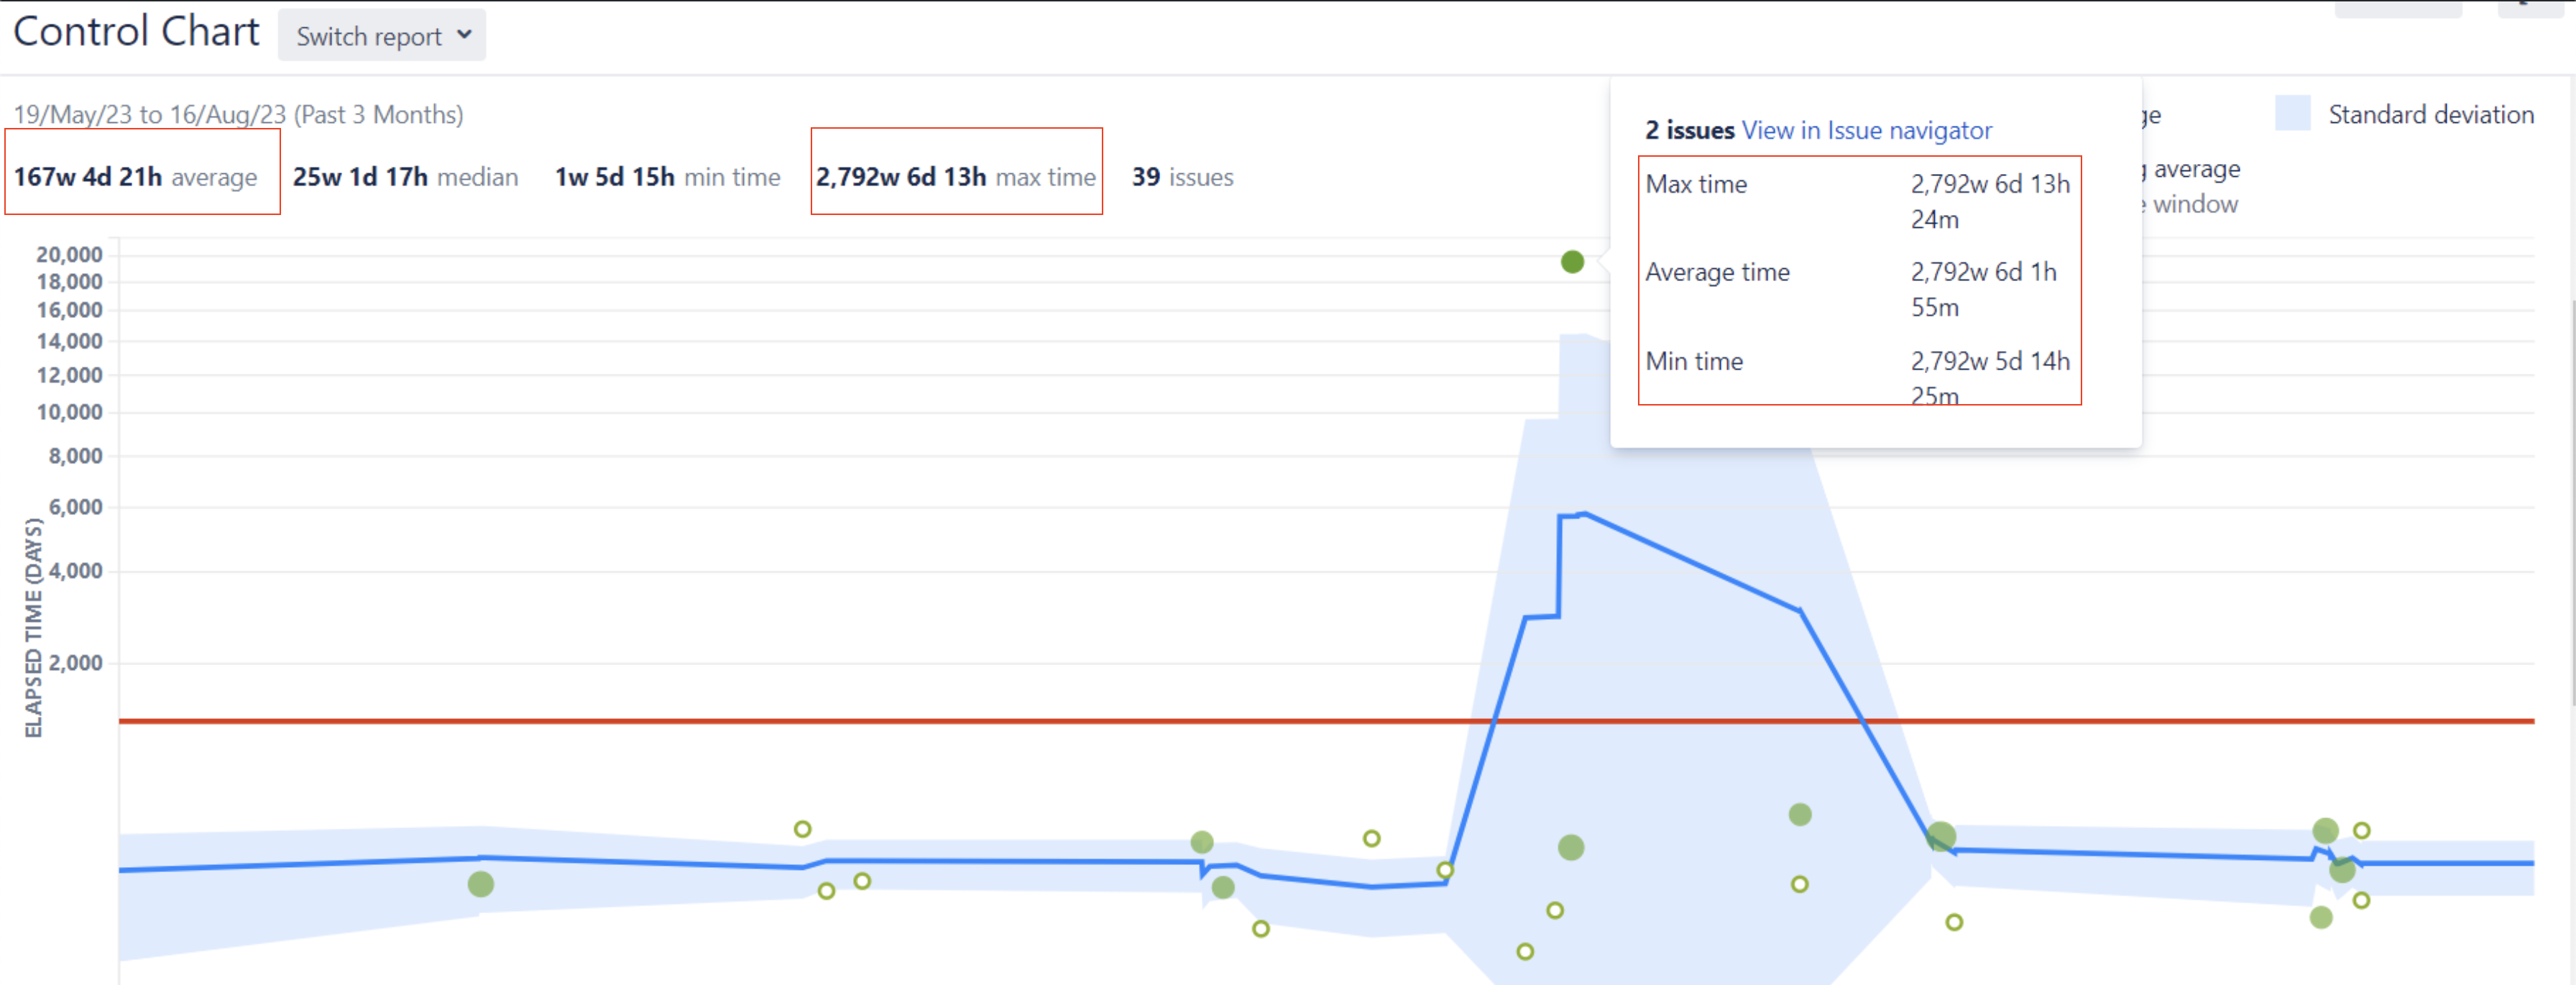
Scenario 1
Upon reviewing the provided screenshot, it is evident that the reported time is 2792 weeks, which is highly unrealistic.
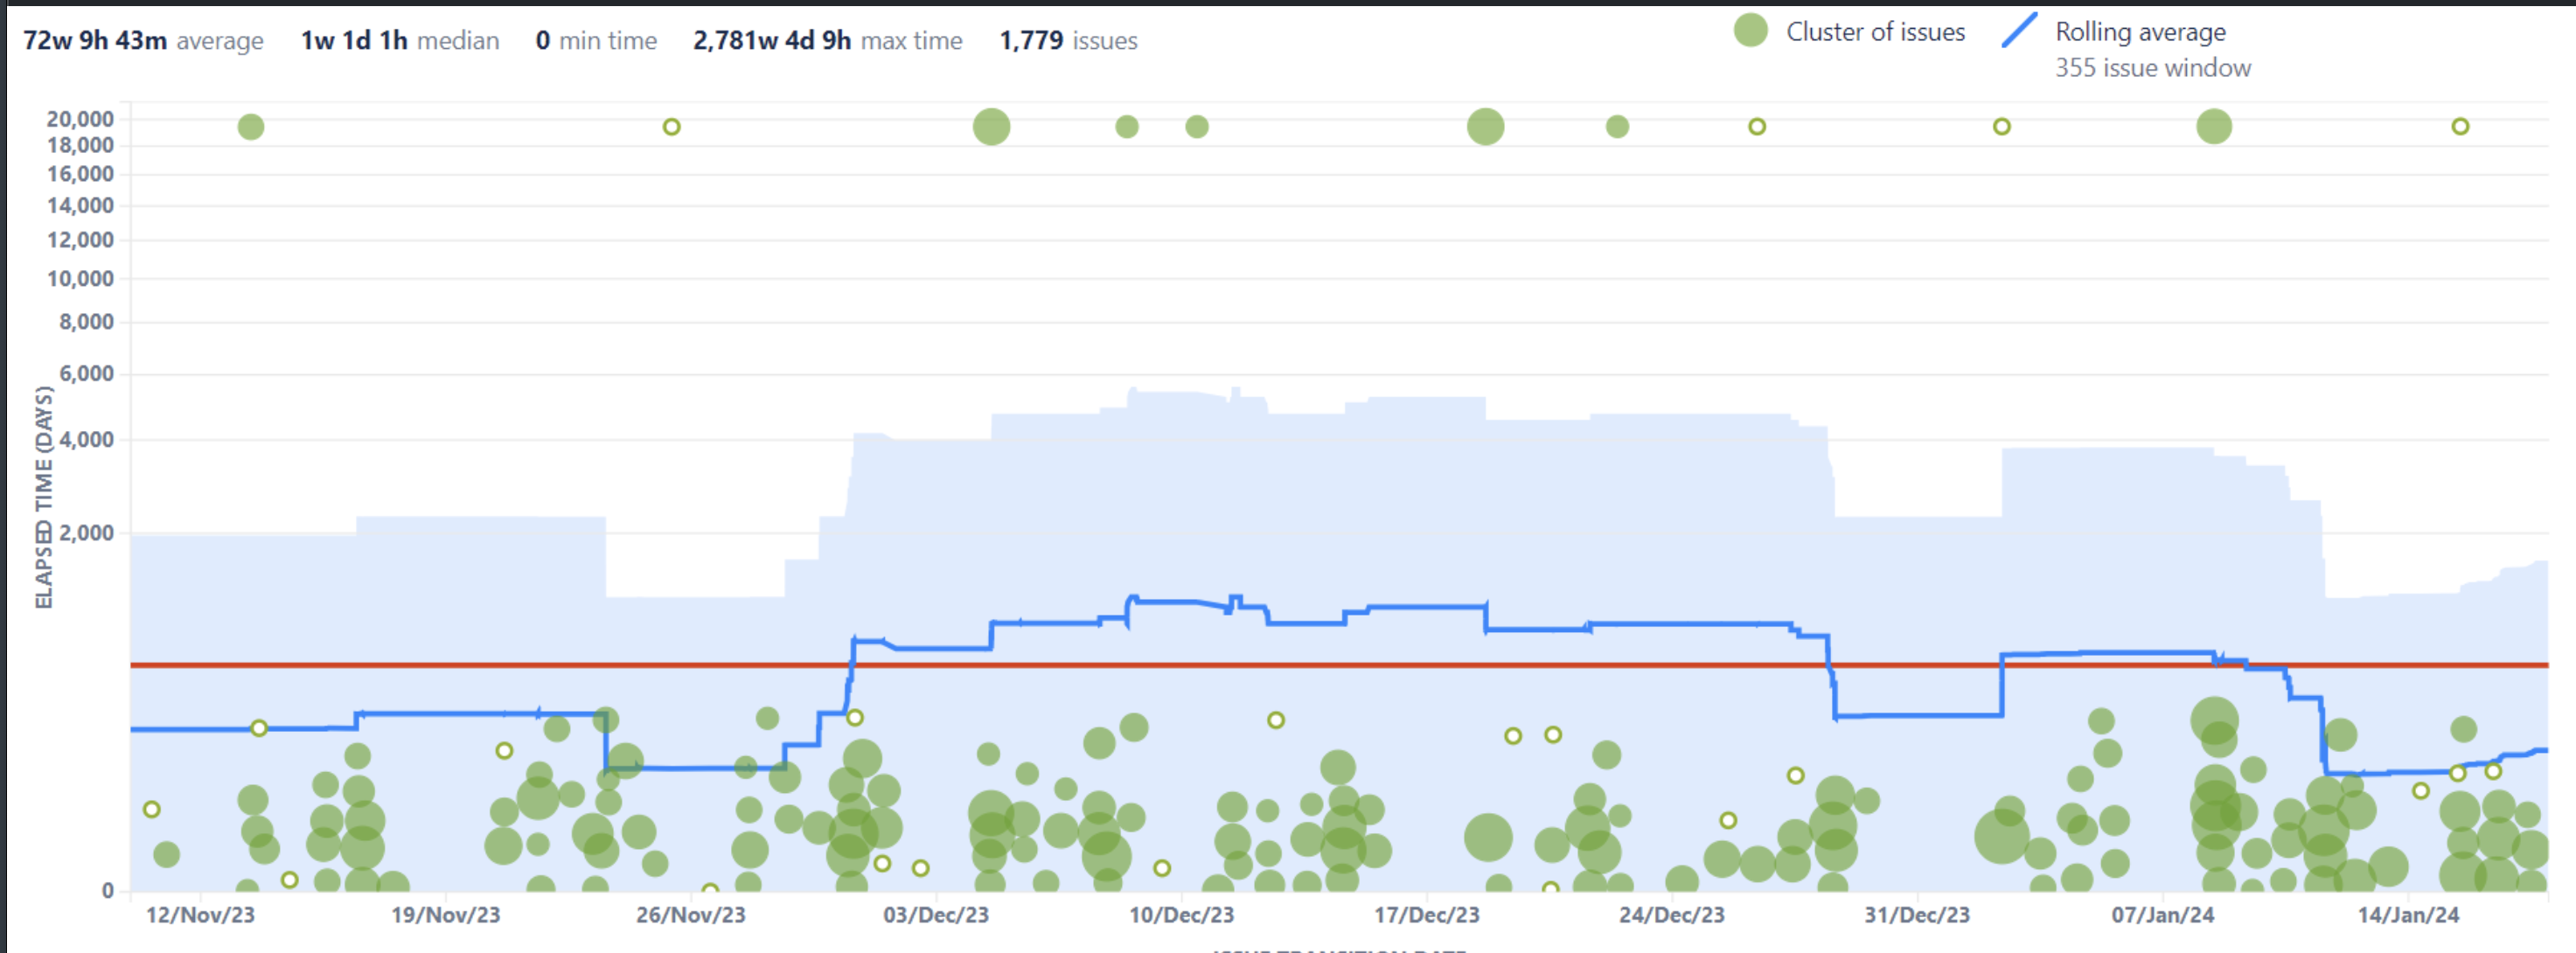
Scenario 2
The Control Chart is displaying incorrect and unrealistic lead time.
Environment
Jira 9.x
Diagnosis
We can obtain the comprehensive output of the Jira REST API to retrieve the complete history (changelog) of all modifications made to a specific issue. This information would be beneficial in gaining insight into when the status of a ticket was altered.
<base.url>/rest/api/2/issue/PRJ1-3096?expand=changelog
<base.url>/rest/api/2/issue/PRJ2-2744?expand=changelog
To further troubleshoot the issue, we can enable the DEBUG level on the com.atlassian.greenhopper.web.rapid.chart package.
Also get output of following sql query for both healthy and problematic issue. User have to replace TESCC with project-key and 3 with issue-num.
SELECT cg.ID, cg.issueid, cg.AUTHOR, cg.CREATED, ci.FIELD, ci.OLDVALUE, ci.OLDSTRING, ci.NEWVALUE, ci.NEWSTRING
FROM changegroup cg
JOIN changeitem ci ON cg.ID = ci.groupid
JOIN jiraissue ji ON cg.issueid = ji.ID
WHERE ji.id = (select a.id from jiraissue a, project b where a.PROJECT = b.id and b.pkey = 'TESCC' and a.issuenum = '3');
Article JIRA Agile Control Chart Display Erroneous Values would help further to troubleshoot Control Chart.
Cause
Scenario 1
Control chart retrieves data from the Jira indexes.
In Jira 8.22.2 and above, a new feature has been introduced that enhances the indexing process. This feature ensures that only the topN issue-related entities such as comments, change history, and worklog are indexed by Jira. You can find more information about this feature in Introducing safeguards to Jira index.
Scenario 2
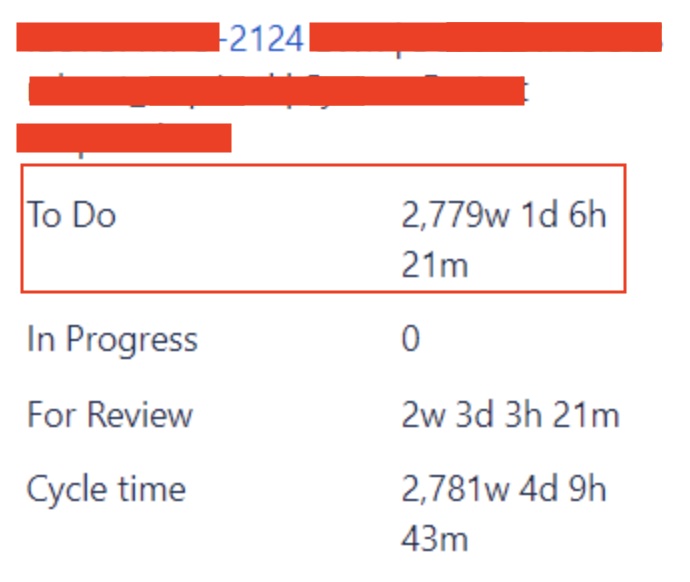
The problematic ticket was transitioned to a different status at the same timestamp.
This problem is due to the "In progress to Done" transition has an equal date and a lower Change Item ID than the "Open to In progress" transition, this causes incorrect initial Status to be written into the index.
Solution
Solution for scenario 1
Jira admins can change default
topNvalues for these entities by setting aJava propertyto the desired limit. System property names for issue entities:jira.safeguards.indexing.issue.changelogs jira.safeguards.indexing.issue.worklogsTo change these properties, please refer to the KB articleHow to change Indexing Limit Safeguards in Jira.
For example, In Jira 8.22.2 and later value for jira.safeguards.indexing.issue.changelogs and jira.safeguards.indexing.issue.worklogs is by default set to 100. This is mentioned in Introducing safeguards to Jira index. So user can set JVM properties like
JVM_SUPPORT_RECOMMENDED_ARGS="-Djira.safeguards.indexing.issue.worklogs=500 -Djira.safeguards.indexing.issue.changelogs=500"
Solution for scenario 2
It appears that some script or automation is performing this transitions at same timestamp. It is recommend to wait for one operation to fully complete before starting a new one. That script or automation should be reviewed.
There is no any way to fix broken report with this problem where transitions are done at same timestamp.
Was this helpful?