Jira is not responsive due to a database connection leak
Platform Notice: Data Center Only - This article only applies to Atlassian apps on the Data Center platform.
Note that this KB was created for the Data Center version of the product. Data Center KBs for non-Data-Center-specific features may also work for Server versions of the product, however they have not been tested. Support for Server* products ended on February 15th 2024. If you are running a Server product, you can visit the Atlassian Server end of support announcement to review your migration options.
*Except Fisheye and Crucible
Summary
Problem
Jira stops responding due to a connection leak. After the restart, the connections will be allocated but they will never be released. When it reaches the limit (pool-max-size defined in the dbconfig.xml), there will not be any available connections for the new requests and Jira will stop responding. The following appears in the atlassian-jira.log:
2021-04-19 12:27:11,903 localhost-startStop-1 ERROR      [NoModule] There was an error getting a DBCP datasource.
java.lang.RuntimeException: Unable to obtain a connection from the underlying connection pool
	at org.ofbiz.core.entity.jdbc.interceptors.connection.ConnectionTracker.trackConnection(ConnectionTracker.java:59)
	at org.ofbiz.core.entity.transaction.DBCPConnectionFactory.trackConnection(DBCPConnectionFactory.java:242)
	at org.ofbiz.core.entity.transaction.DBCPConnectionFactory.getConnection(DBCPConnectionFactory.java:73)
	at org.ofbiz.core.entity.ConnectionFactory.tryGenericConnectionSources(ConnectionFactory.java:69)
	at org.ofbiz.core.entity.transaction.JNDIFactory.getConnection(JNDIFactory.java:146)
	at org.ofbiz.core.entity.TransactionFactory.getConnection(TransactionFactory.java:101)
	at org.ofbiz.core.entity.ConnectionFactory.getConnection(ConnectionFactory.java:59)
	at org.ofbiz.core.entity.jdbc.SQLProcessor.getConnection(SQLProcessor.java:367)
	at org.ofbiz.core.entity.jdbc.SQLProcessor.prepareStatement(SQLProcessor.java:515)
	at org.ofbiz.core.entity.GenericDAO.selectListIteratorByCondition(GenericDAO.java:844)
	at org.ofbiz.core.entity.GenericDAO.selectByCondition(GenericDAO.java:793)
	at org.ofbiz.core.entity.GenericDAO.selectByCondition(GenericDAO.java:772)
	at org.ofbiz.core.entity.GenericHelperDAO.findByCondition(GenericHelperDAO.java:178)
	at org.ofbiz.core.entity.GenericDelegator.findByCondition(GenericDelegator.java:1083)
Diagnosis
Diagnostic Steps
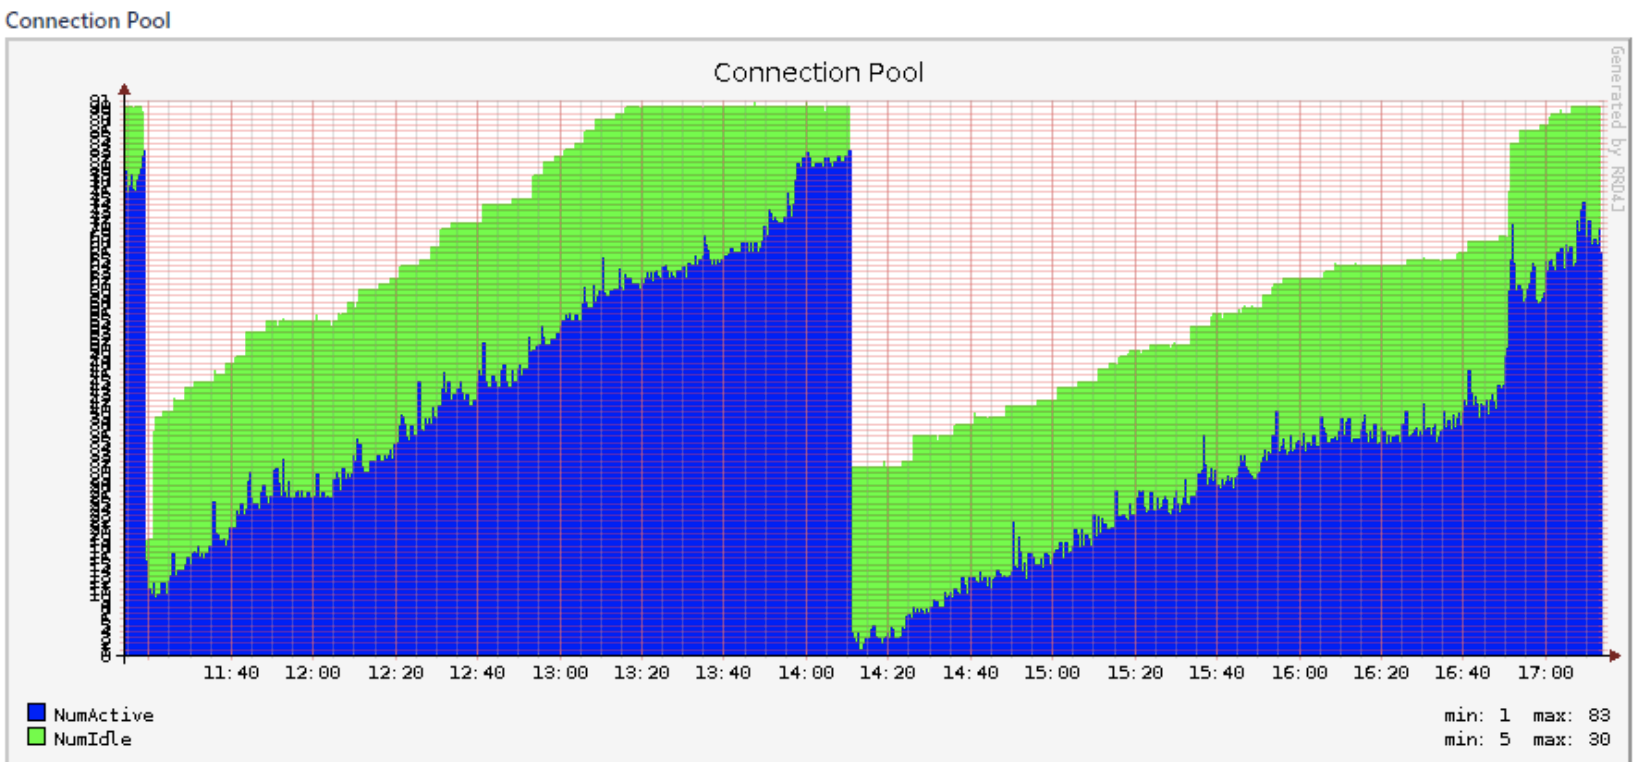
Navigate to Administration > System > Database Monitoring, and review the database connection usage. You should see a connection pooling like below:
Cause
The problem mostly happens because of a plugin. Hence, please check if you recently installed or upgraded any third-party plugins before the issue started.
Solution
Workaround
Follow the steps below to remove the leaked connections automatically:
Navigate to <JIRA_HOME> and edit dbconfig.xml via a text editor on each node
Make sure that
pool-remove-abandonedis set totrueandpool-remove-abandoned-timeoutis also set (default value: 300 seconds).ℹ️ This method removes the abandoned connections when the pool is filled up, being a less aggressive and default behavior in the latest Jira versions.
If the parameters above don't work and/or you wish for a more aggressive approach, add the
pool-remove-abandoned-on-maintenanceparameter:
<pool-remove-abandoned-on-maintenance>true</pool-remove-abandoned-on-maintenance>Set
time-between-eviction-runs-millisto 10000 (10 seconds):
<time-between-eviction-runs-millis>10000</time-between-eviction-runs-millis>Restart Jira
Resolution
As mentioned above, the problem mostly happens because of a third-party plugin. Before raising a ticket to Atlassian Support, review the recent changes in the environment.
Other than that, finding out a connection leak is a quite complex task and it needs Support assistance. Therefore, please raise a Support ticket to Atlassian Support.
Was this helpful?