How to understand SLA reports calculation
Platform Notice: Data Center Only - This article only applies to Atlassian apps on the Data Center platform.
Note that this KB was created for the Data Center version of the product. Data Center KBs for non-Data-Center-specific features may also work for Server versions of the product, however they have not been tested. Support for Server* products ended on February 15th 2024. If you are running a Server product, you can visit the Atlassian Server end of support announcement to review your migration options.
*Except Fisheye and Crucible
Summary
This article is a brief explanation of values in the SLA reports are calculated and displayed. It is aimed clarify any minor incorrect values or discrepancies in the reporter.
For example:
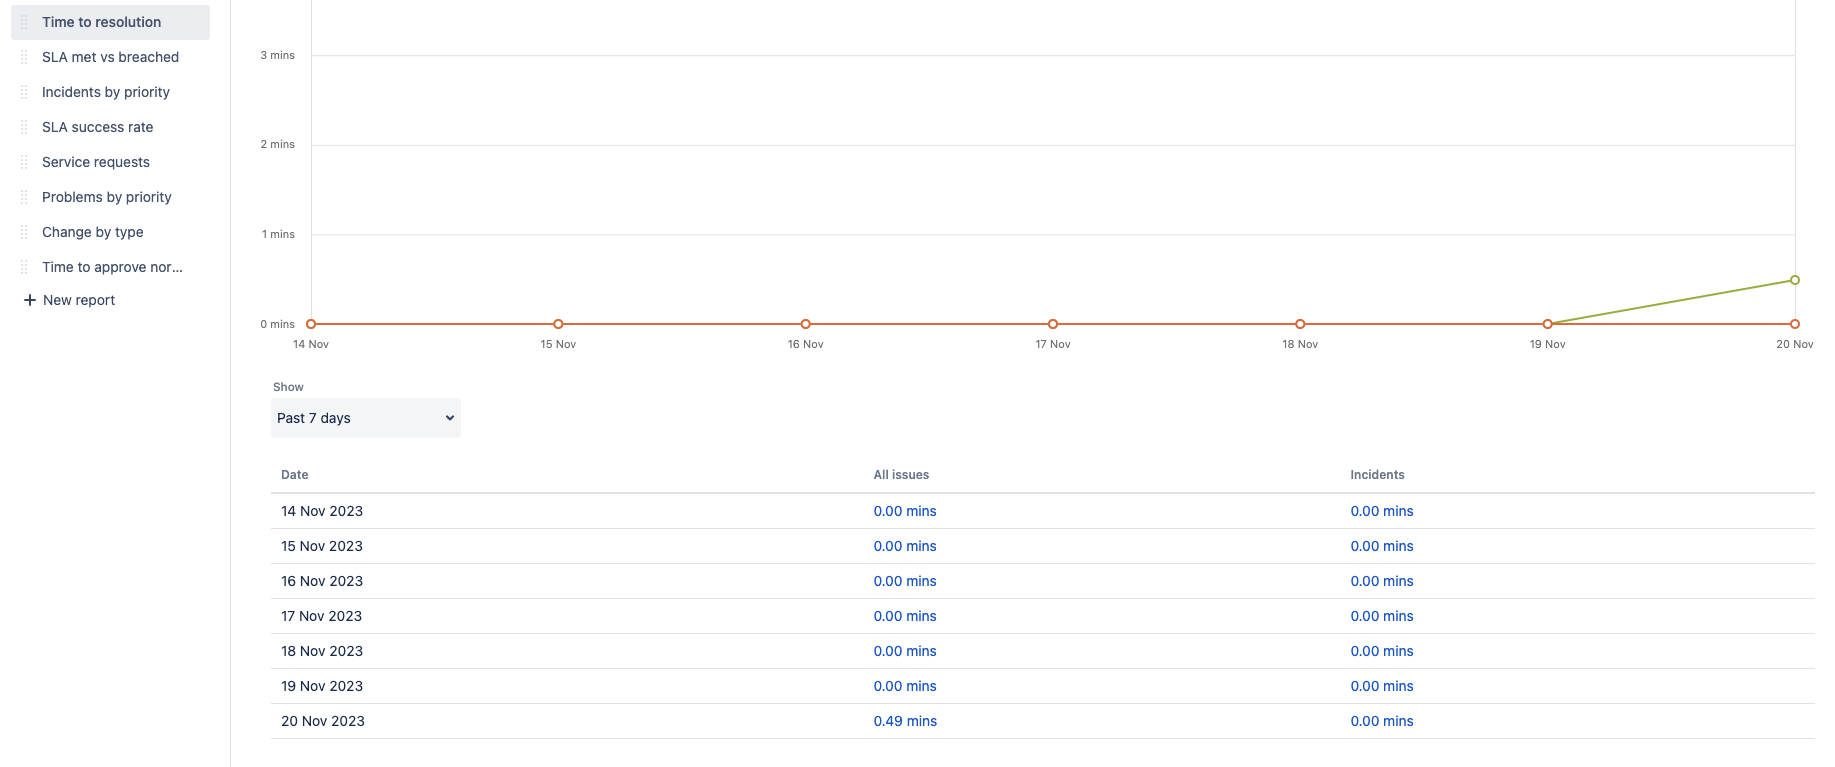
In the Time to resolution report below, we can see 0.49 minutes for 20 Nov 2023.
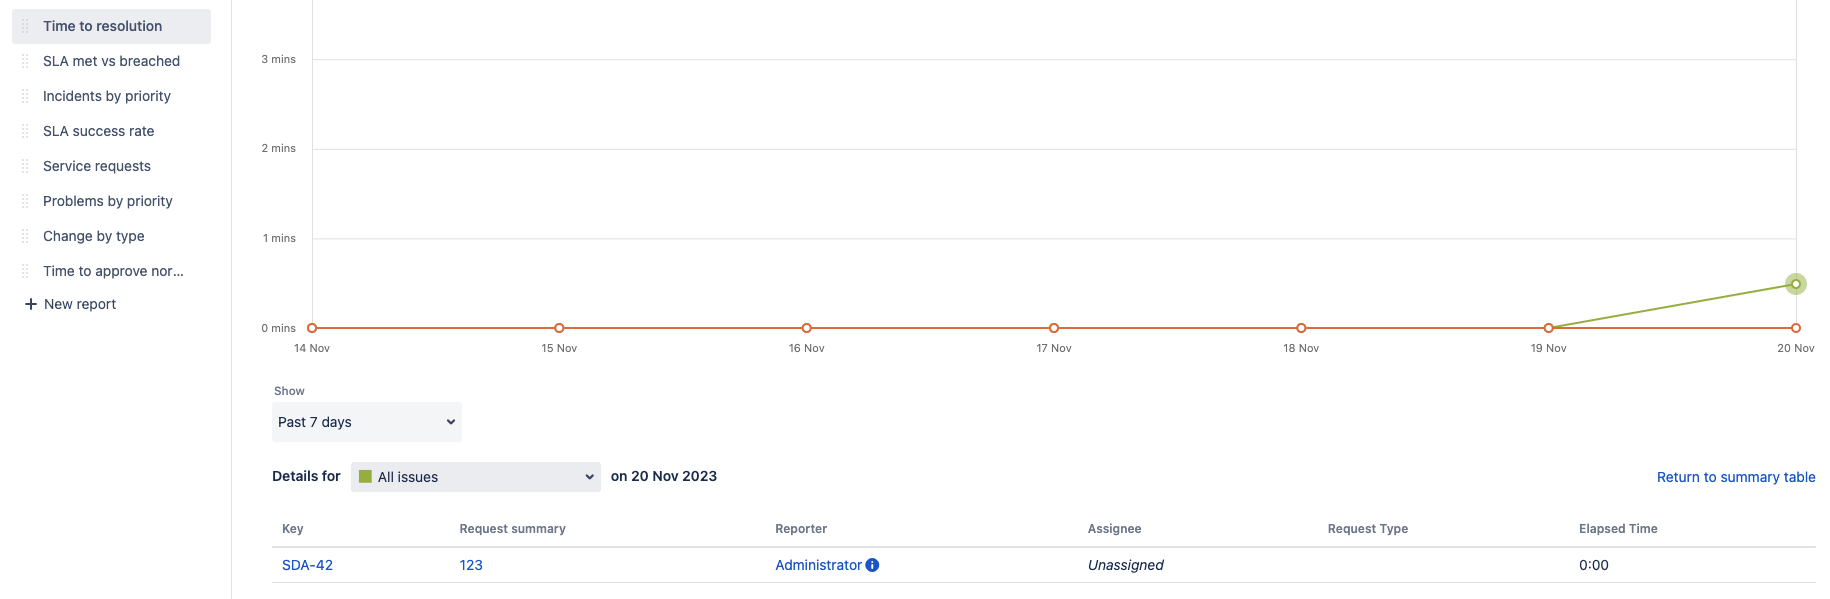
When clicking on 0.49 mins hyperlink, you will see the next page which highlights all the issues and their respective elapsed time. The values in elapsed time (0:00 in this example) does not completely match the value in the previous page.
Environment
Any version of Jira Service Management
Solution
The value in the first page is in decimal format. 90 seconds is written as 1.5 mins.
The value in the second page is in hh:mm format. 90 seconds is written as 0:02. This is equivalent to 90 seconds rounded to the nearest minute, which is 2 minutes.
Calculation of the values are done based on elapsed time in milliseconds first, which is then converted to the above 2 formats.
To identify the Elapsed Time in milliseconds, you can access the JSON values of the issue using the steps below
If your issue URL is
http://<Base URL>/browse/SDA-42, you can accesshttp://<Base URL>/rest/api/2/issue/SDA-42Search for the relevant SLA. In this example, it is 'Time to resolution'
    "customfield_10120": {
      "id": "1",
      "name": "Time to resolution",
      "_links": {
        "self": "http://localhost:45113/j5113/rest/servicedeskapi/request/10100/sla/1"
      },
      "completedCycles": [
        {
          "startTime": {
            "iso8601": "2023-11-20T12:24:32+0100",
            "jira": "2023-11-20T12:24:32.928+0100",
            "friendly": "Just now",
            "epochMillis": 1700479472928
          },
          "stopTime": {
            "iso8601": "2023-11-20T12:25:02+0100",
            "jira": "2023-11-20T12:25:02.399+0100",
            "friendly": "Just now",
            "epochMillis": 1700479502399
          },
          "breached": false,
          "goalDuration": {
            "millis": 28800000,
            "friendly": "8h"
          },
          "elapsedTime": {
            "millis": 29471,
            "friendly": "0m"
          },
          "remainingTime": {
            "millis": 28770529,
            "friendly": "7h 59m"
          }
        }
      ]
    },
Look for elapsedTime and you will see the values of the elapsed time in milliseconds. In this example, it is 29471ms
29471ms is 29.471 seconds.
First page is calculated by (29.471/60)=0.49. Hence the displayed value is 0.49 mins
Second page is 29.471 seconds rounded to the nearest minute. In this case, it is rounded down to 0 minutes. Hence, the displayed value for Elapsed Time is 0:00
Due to the way the SLAs are calculated and displayed, you might see some minor discrepancies in these report values, normally ranging within a few seconds. This is normal and expected based on the current implementation.
Was this helpful?