How does the Service Management "Time to resolution" report work?
Platform Notice: Cloud Only - This article only applies to Atlassian apps on the cloud platform.
Summary
This is an explanation of how the Time to resolution (TTR) report in Jira Service Management works.
Solution
Each data point (dot) on the graph refers to the average time to resolution for all work items on that particular day.
Example
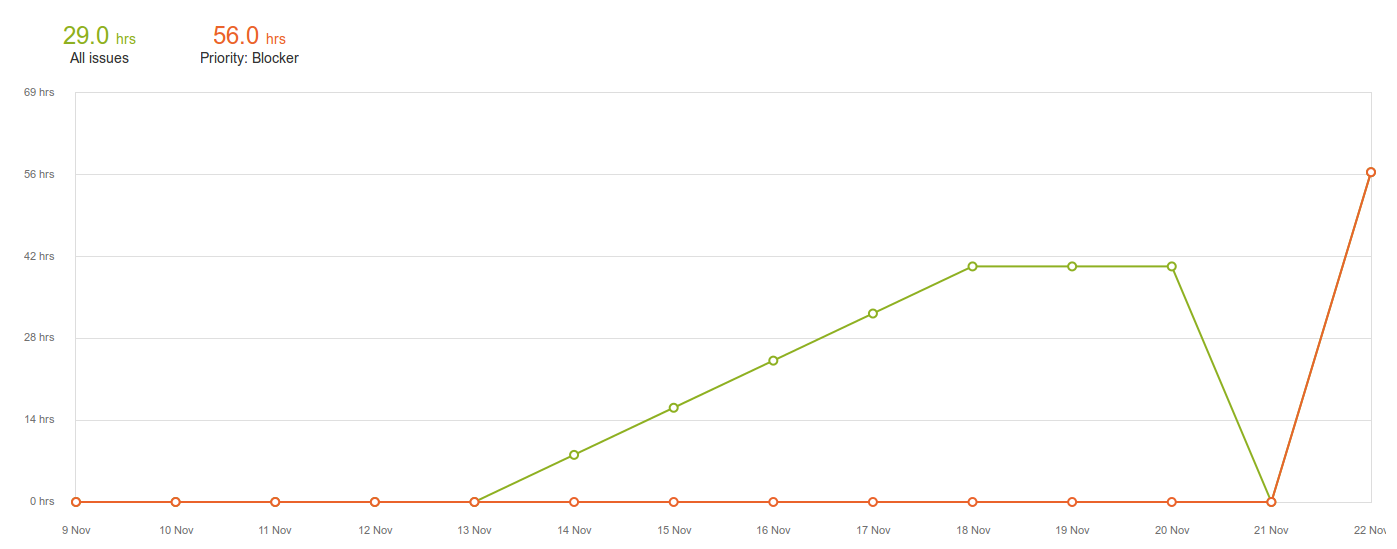
The first data point above 0h for all work items (green) is on the 14th of November with a value of 8h. This means that on the 14th of November, all resolved work items have an average time to resolution of 8h. This can be in various scenarios, such as the following:
Only one work item was resolved with a TTR of 8h.
Two work items resolved, where the total TTR of these work items is 16h (e.g., 8h/8h, 2h/14h, 10h/6h). 16h divided by 2 (issues) is 8h.
Three work items resolved, where the total TTR of these work items is 24h (e.g., 2h/2h/20h, 5h/5h/14h, 8h/10h/6h). 24h divided by 3 (issues) is 8h.
Basically, Y work items resolved, where total TTR of these issues 8h x Y.
To calculate the total average (29h for All work items, 56h for Blocker work items), please refer to the article: How to calculate Average Time to Resolution SLA for Service Management.
Was this helpful?