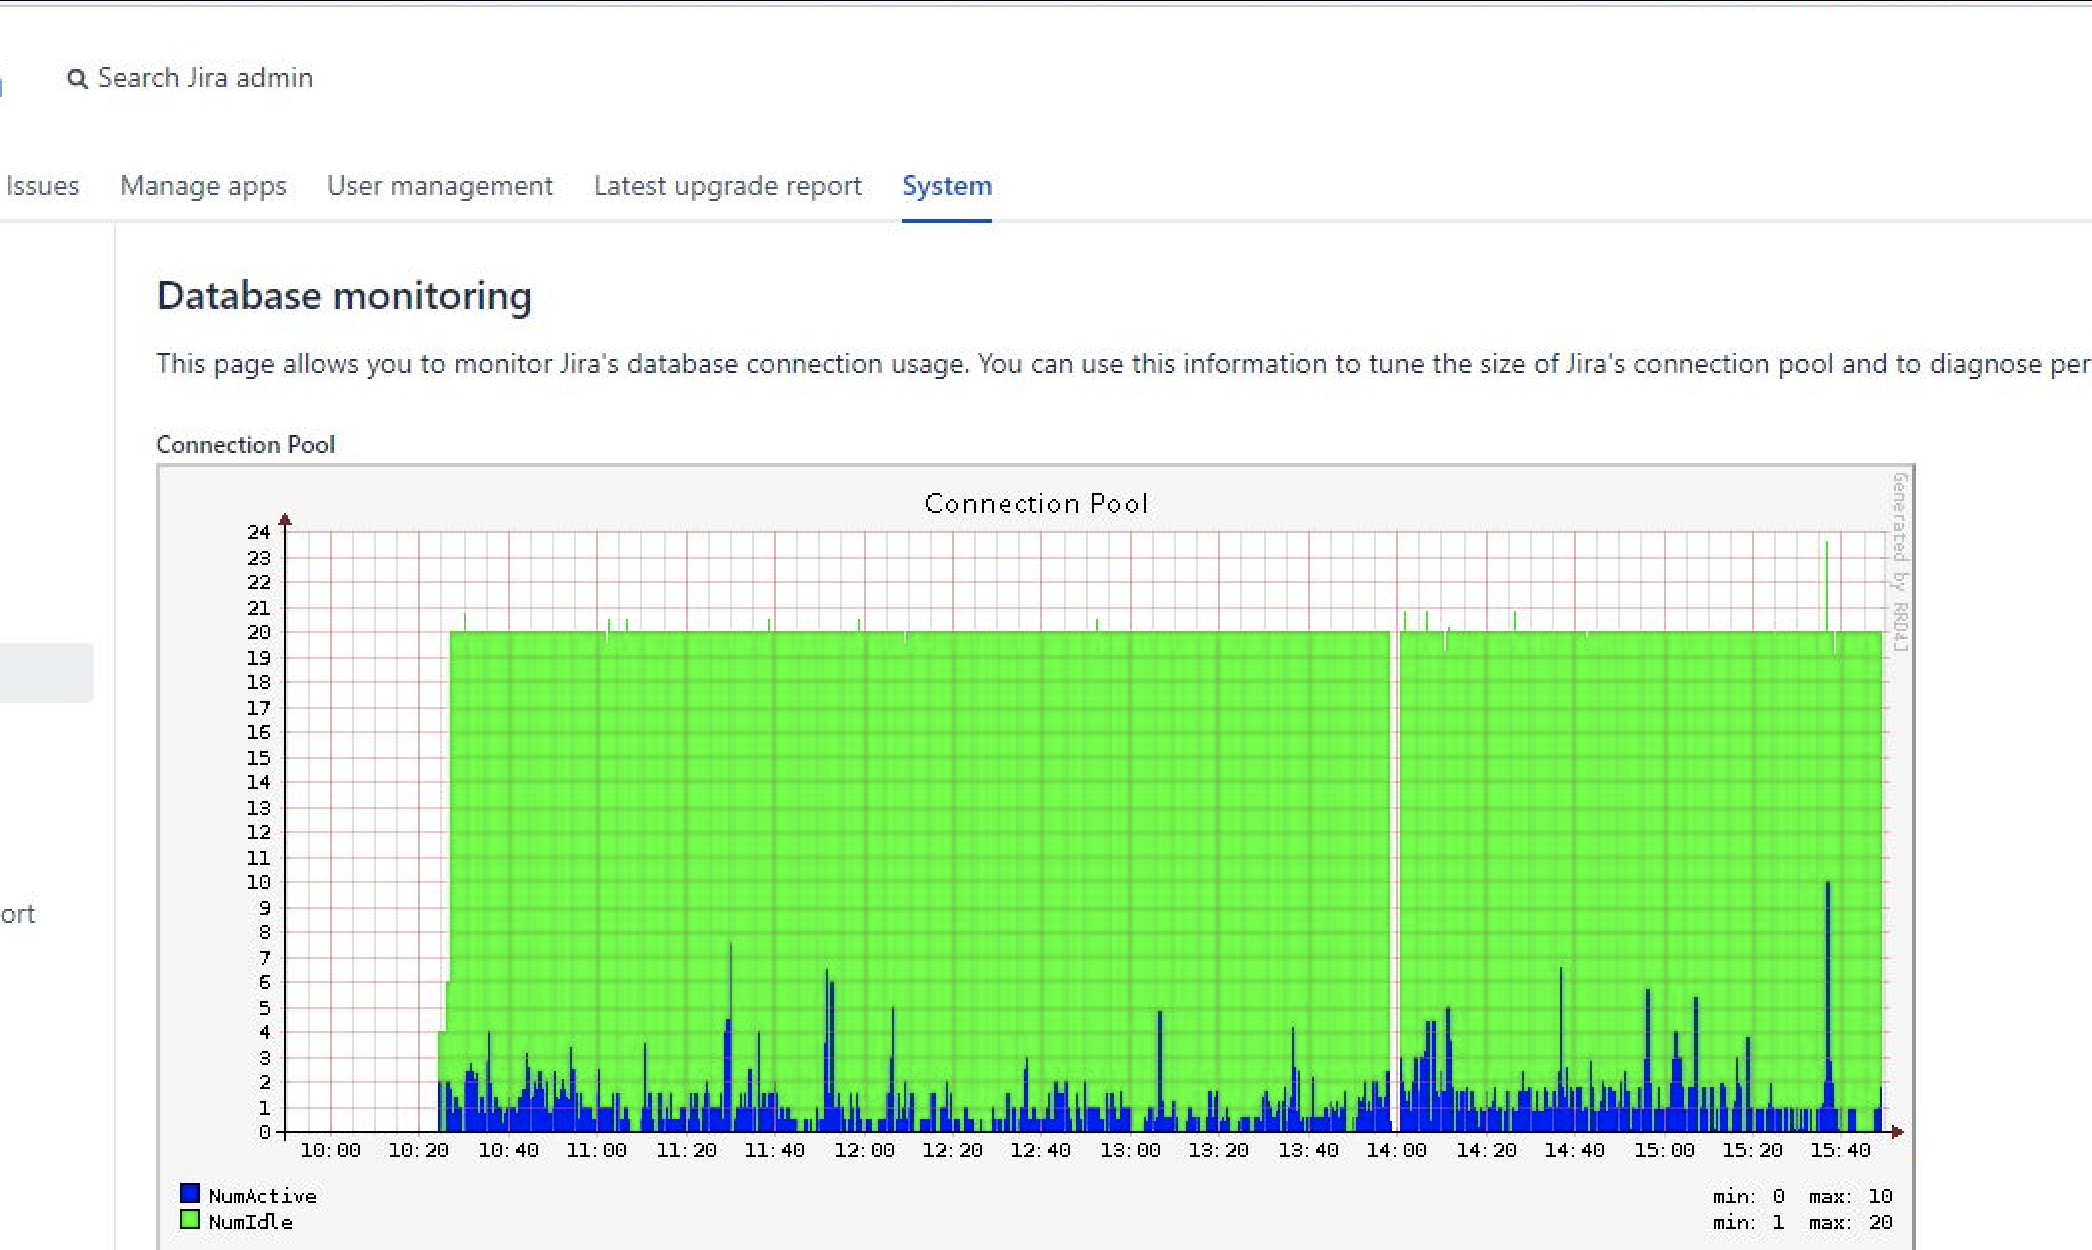
Database monitoring graph shows a gap where no dbcp pool information is recorded
Platform Notice: Data Center Only - This article only applies to Atlassian apps on the Data Center platform.
Note that this KB was created for the Data Center version of the product. Data Center KBs for non-Data-Center-specific features may also work for Server versions of the product, however they have not been tested. Support for Server* products ended on February 15th 2024. If you are running a Server product, you can visit the Atlassian Server end of support announcement to review your migration options.
*Except Fisheye and Crucible
Summary
At times, it is noticed in the customer environment, that database monitoring page shows a interrupt or gap in the dbcp pool connection being recorded. This might cause concern whether there was a loss in database connection or database availability even when the Jira node and the database were up and running.
Environment
9.x
Diagnosis
Whenever there is a node restart, these kind of gaps in the monitoring tool graph are expected. But if such interruptions appear at times of normal routine, its worth investigating in a couple of places. The database monitoring graph is plotted utilizing the *.rrd4j files created under the $JIRA_HOME/monitor directory. The com.atlassian.jira.plugins.monitor.rrd4j.RrdUpdater class is responsible for creating and updating these files with data points collected at various time period. While enabling debug logging on this package might provide information during certain error scenarios, it may not at times explain the gap in logging of the data point for the graph.
So we can utilize the database monitoring statistics logged in the atlassian-jira-pref.log found under the $JIRA_HOME/log directory to understand and correlate the connection pool information. These statistics are logged every minute and if the gap is large enough, then we might be able to capture the DB related data points around that time from this log.
Cause
In this case, we can gather dbcp information from the Atlassian-jira-perf.log as follows. Install json parser jq as a prerequisite
cat atlassian-jira-perf.log | awk '/PLATFORMINSTRUMENTS/{$1="";$2="";$3="";print}' | jq -r '.|[.timestamp,(.instrumentList[]|select(.name|contains("dbcp"))|.value)] | @tsv'| gawk '{print strftime("%d-%m-%Y %H:%M:%S",$1),$2,$3,$4}' | sort -nk2Looking at the output you might notice a gap in the logging of information, around the time the gap is observed between 12:57 and 12:59, with no data for the minute 12:58. This translates to the time period shown in the graph for an instance which is one hour ahead in the server timezone
27-02-2023 12:56:08 -1 20 1
27-02-2023 12:57:08 -1 20 0
27-02-2023 12:59:34 -1 13 7
27-02-2023 12:59:34 -1 16 10
In case there are no reports of a node outage, node non-responsiveness or full garbage collection incidents, we might want to explore the possibility of high cpu load average being a factor. The threads that log these metrics and statistics might be de-prioritized during such high load conditions. This will prevent them from logging the data point for a certain time period. We could confirm the same by looking at the system load average around the same period. Below we could see that the gap in the data was preceded and succeeded by short burst high system load average around the same period.
cat atlassian-jira-perf.log |  awk '/JMXINSTRUMENTS-OS/{$1="";$2="";$3="";print}' | jq -r '.[] | [.timestamp,(.attributes[]|select(.name|contains("SystemLoadAverage"))|.value)] | @tsv' |  gawk '{print strftime("%d-%m-%Y %H:%M:%S",$1),$2,$3,$4}' | sort -nk2

.....
27-02-2023 12:56:08 3.78
27-02-2023 12:57:08 2.77
27-02-2023 12:59:33 102.86
27-02-2023 12:59:33 102.86
27-02-2023 13:00:08 63.05
27-02-2023 13:01:08 25.87
........
Solution
The database monitoring graph is meant to provide a overview of the connection pool usage over time. This is a valuable database graph for any one trying to understand if they need to increase or decrease the max-pool-size parameter. At times, when some data looks out of place, you may want to leverage similar data points logged in other logs such as atlassian-jira-perf.log to find the root cause.
Was this helpful?