Use Windows Process Explorer to troubleshoot Jira server Performance
プラットフォームについて: Data Center のみ。 - This article only applies to Atlassian apps on the Data Center プラットフォーム。
この KB は Data Center バージョンの製品用に作成されています。Data Center 固有ではない機能の Data Center KB は、製品のサーバー バージョンでも動作する可能性はありますが、テストは行われていません。 Server* 製品のサポートは 2024 年 2 月 15 日に終了しました。Server 製品を実行している場合は、 アトラシアン Server サポート終了 のお知らせにアクセスして、移行オプションを確認してください。
*Fisheye および Crucible は除く
概要
This article outlines a way to analyze Jira application performance using Process Explorer on Windows. You'll need to collect thread dumps and correlate that with the thread IDs from Process Explorer.
⚠️ This will only work for Windows systems and requires the use of a third-party application.
ℹ️ For *nix system please see Troubleshooting Jira performance with Thread dumps. Another option for a high level overview is Using jvmtop to analyze JIRA performance.
環境
Jira Data Center
セットアップ
Download Process Explorer and run it on the server JIRA application is installed;
ℹ️This is a third-party application, and as such it's not supported by Atlassian.
Locate the
tomcat.exeprocess, which is the application server that serves JIRA application;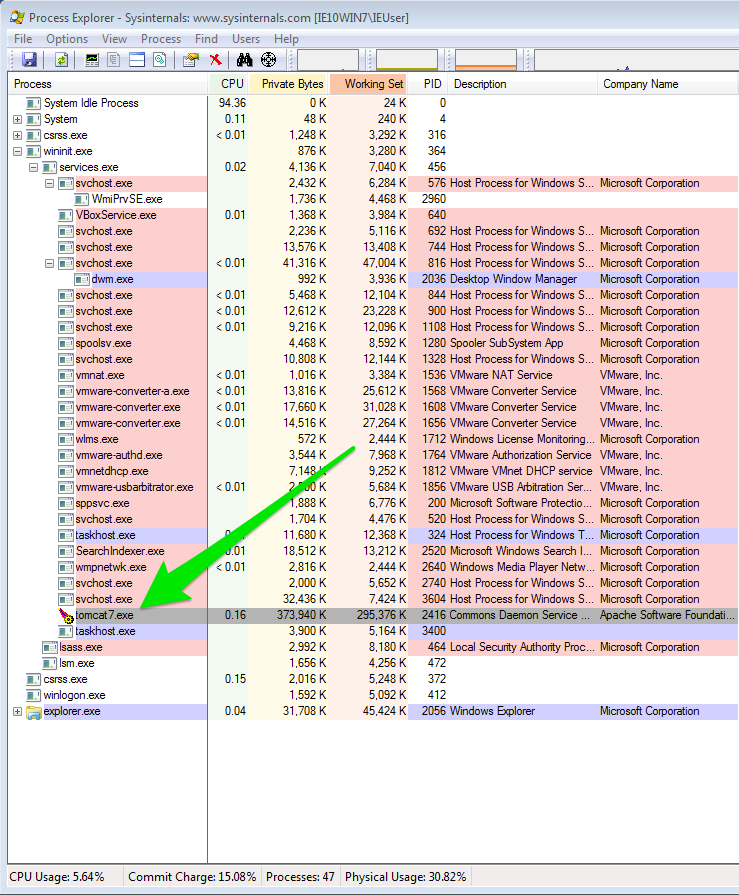
Right-click the process and select Properties.
Go to the Threads tab to get an overview of the running threads within the process.
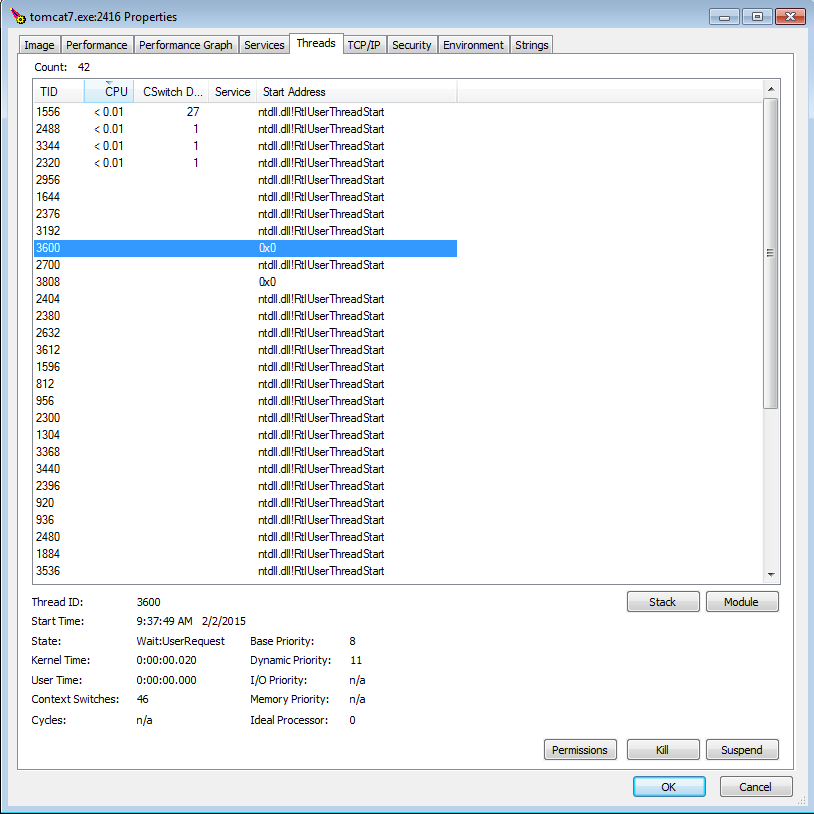
ℹ️The first column is the thread ID (TID) and the second column is the CPU utilization for each thread. Notice that the thread ID (TID) in Process Explorer is in Decimal format and corresponds to NID in the thread dumps. NID in thread dumps is in hexadecimal, so you will need to convert decimal to hexadecimal to identify those threads
With this information, we can now see which threads are consuming the most CPU and relate with what's being performed by each, as reported in the thread dumps;
Providing Information to Support
Atlassian Support may request thread dumps when troubleshooting Jira application. Adding additional information showing which threads are consuming the most CPU may considerably expedite the troubleshooting process.
この内容はお役に立ちましたか?