JQL Issue searches are very slow only for a specific user
プラットフォームについて: Data Center のみ。 - This article only applies to Atlassian apps on the Data Center プラットフォーム。
この KB は Data Center バージョンの製品用に作成されています。Data Center 固有ではない機能の Data Center KB は、製品のサーバー バージョンでも動作する可能性はありますが、テストは行われていません。 Server* 製品のサポートは 2024 年 2 月 15 日に終了しました。Server 製品を実行している場合は、 アトラシアン Server サポート終了 のお知らせにアクセスして、移行オプションを確認してください。
*Fisheye および Crucible は除く
要約
For a specific user, the JQL issue search is found to be very slow compared to other users utilizing the same filter shared with them, for the issue search. In spite of logging in through various workstations and assigning different privileges to other users on par with the current user with the problem, the results remain the same with slow query results.
環境
8.20.x or above
診断
The problem can be diagnosed by making use of the following
Profiling logs enabled from the logging and profiling page. - Logging and profiling
Thread dumps generated when the issue search is run. - Generating a thread dump
HAR file generated for the same search between two users. - Generating HAR files and analyzing web requests
For the current example we could notice the difference in the number of results of the query run. There is a difference in the number of results retrieved for the same issue search between the user 'Athualpa' who has the slow issue search problem, compared to the user 'cajamarca' who has a faster load time.
Profiling log output
2022-07-19 12:49:58,671-0400 https-jsse-nio-443-exec-5689 DEBUG Athualpa 768x49888680x22 9tvbem xx.xxx.xx.xx,yy.yyy.yy.yyy /rest/issueNav/1/issueTable [c.a.j.web.filters.ThreadLocalQueryProfiler] RESULT GROUP: OfBizDelegator
2022-07-19 12:49:58,671-0400 https-jsse-nio-443-exec-5689 DEBUG Athualpa 768x49888680x22 9tvbem xx.xxx.xx.xx,yy.yyy.yy.yyy /rest/issueNav/1/issueTable [c.a.j.web.filters.ThreadLocalQueryProfiler] 152:144ms findByPrimaryKey [1,0,0,4,3,1,1,0,1,0,1,0,0,0,1,0,1,7,1,1,0,1,1,2,1,1,0,1,0,1,1,0,0,1,1,1,2,1,0,0,0,0,1,1,1,2,1,1,1,1,1,0,0,1,5,1,4,4,1,0,1,1,0,1,1,1,1,1,1,2,1,1,0,0,1,1,1,3,1,1,1,1,1,1,0,0,0,0,1,0,1,1,1,1,1,1,1,1,1,2,1,1,1,1,0,0,1,1,1,1,1,1,0,0,1,1,1,0,0,4,5,2,1,0,0,0,0,1,1,1,0,1,1,1,1,1,1,0,1,1,1,0,1,1,1,0,0,0,1,1,1,1]
2022-07-19 12:49:58,671-0400 https-jsse-nio-443-exec-5689 DEBUG Athualpa 768x49888680x22 9tvbem xx.xxx.xx.xx,yy.yyy.yy.yyy /rest/issueNav/1/issueTable [c.a.j.web.filters.ThreadLocalQueryProfiler] OfBizDelegator: 152 keys (1 unique) took 144ms/84426ms : 0.17056356% 144ms/query avg.
............
022-07-19 12:51:17,555-0400 https-jsse-nio-443-exec-5690 DEBUG cajamarca 771x49890313x6 162qgkv xx.xxx.xx.xx,yy.yyy.yy.yyy /rest/issueNav/1/issueTable [c.a.j.web.filters.ThreadLocalQueryProfiler] RESULT GROUP: OfBizDelegator
2022-07-19 12:51:17,555-0400 https-jsse-nio-443-exec-5690 DEBUG cajamarca 771x49890313x6 162qgkv xx.xxx.xx.xx,yy.yyy.yy.yyy /rest/issueNav/1/issueTable [c.a.j.web.filters.ThreadLocalQueryProfiler] 39:35ms findByPrimaryKey [1,2,1,1,0,1,1,0,1,0,1,1,1,1,1,2,1,1,0,1,0,1,1,2,1,2,2,1,1,0,1,1,0,1,1,0,1,1,0]
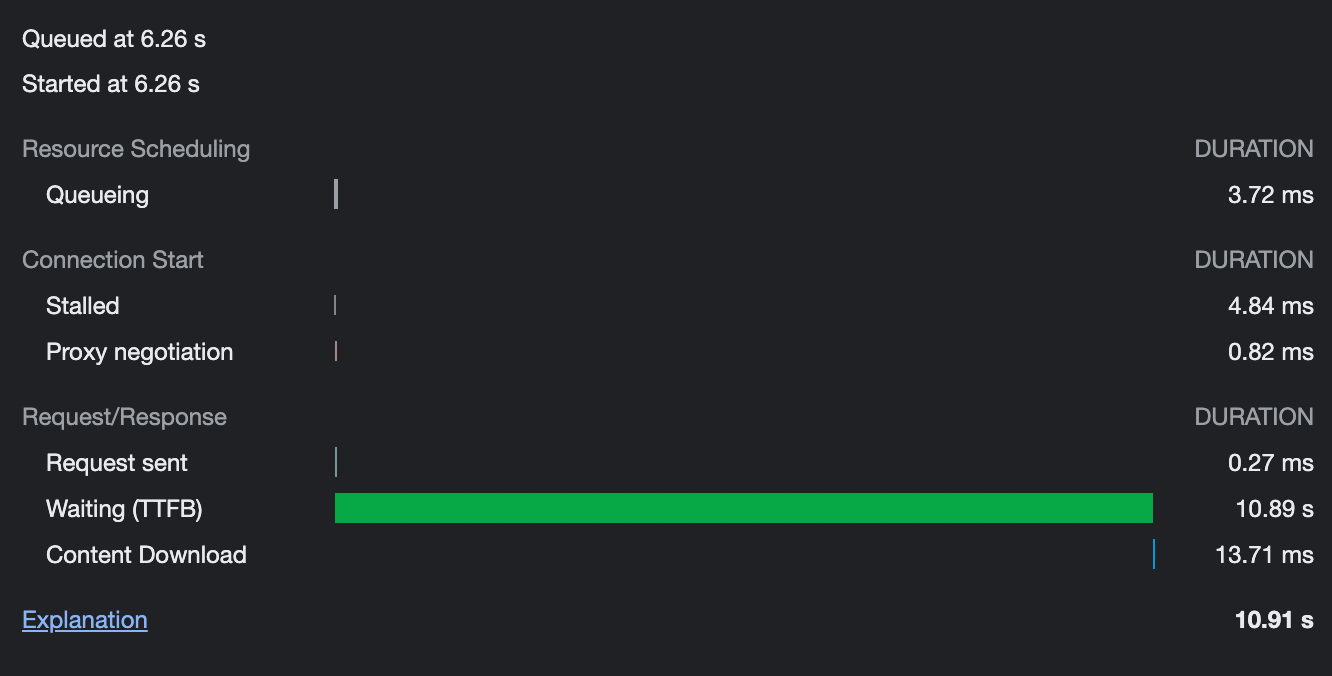
2022-07-19 12:51:17,555-0400 https-jsse-nio-443-exec-5690 DEBUG cajamarca 771x49890313x6 162qgkv xx.xxx.xx.xx,yy.yyy.yy.yyy /rest/issueNav/1/issueTable [c.a.j.web.filters.ThreadLocalQueryProfiler] OfBizDelegator: 39 keys (1 unique) took 35ms/2832ms : 1.2358757% 35ms/query avg.The HAR file would indicate long duration for the Time to first byte indicating a wait on the server.
Looking at the thread dumps, we can notice that the thread spawned for the request with the URL: /rest/issueNav/1/issueTable will be long-running and have a stack similar to the one below.
Stack Trace
https-jsse-nio-443-exec-5689 url: /rest/issueNav/1/issueTable; user: Athualpa" #12297925 daemon prio=5 os_prio=0 tid=0x000000026463a000 nid=0x1d1c runnable [0x0000000206716000]
   java.lang.Thread.State: RUNNABLE
.........	com.atlassian.cache.ehcache.wrapper.ValueProcessorAtlassianCacheLoaderDecorator.load(ValueProcessorAtlassianCacheLoaderDecorator.java:26)
com.atlassian.cache.ehcache.LoadingCache.getFromLoader(LoadingCache.java:174)
com.atlassian.cache.ehcache.LoadingCache75580Lambda/1252274270.apply(Unknown Source)
com.atlassian.cache.ehcache.SynchronizedLoadingCacheDecorator.synchronizedLoad(SynchronizedLoadingCacheDecorator.java:29)	com.atlassian.cache.ehcache.LoadingCache.loadValueAndReleaseLock(LoadingCache.java:142)
	com.atlassian.cache.ehcache.LoadingCache.get(LoadingCache.java:121)
	com.atlassian.cache.ehcache.DelegatingCache.get(DelegatingCache.java:108)
	com.xiplink.jira.git.jql.GitBranchCF.getValueFromIssue(GitBranchCF.java:92)
	com.xiplink.jira.git.jql.GitBranchCF.getValueFromIssue(GitBranchCF.java:26)
........
com.atlassian.jira.issue.fields.ImmutableCustomField.getColumnViewHtml(ImmutableCustomField.java:814)
com.atlassian.jira.issue.fields.layout.column.ColumnLayoutItemImpl.getHtml(ColumnLayoutItemImpl.java:103)
........
com.atlassian.jira.template.velocity.DefaultVelocityTemplatingEngine.toWriterImpl(DefaultVelocityTemplatingEngine.java:122)
com.atlassian.jira.template.velocity.DefaultVelocityTemplatingEngine.asHtml(DefaultVelocityTemplatingEngine.java:113)
com.atlassian.jira.web.component.AbstractWebComponent.asHtml(AbstractWebComponent.java:44)
......
com.atlassian.jira.plugin.issuenav.service.issuetable.AbstractIssueTableCreator.create(AbstractIssueTableCreator.java:206)
com.atlassian.jira.plugin.issuenav.service.issuetable.DefaultIssueTableService.createIssueTableFromCreator(DefaultIssueTableService.java:176)
com.atlassian.jira.plugin.issuenav.service.issuetable.DefaultIssueTableService.getIssueTable(DefaultIssueTableService.java:280)
com.atlassian.jira.plugin.issuenav.service.issuetable.DefaultIssueTableService.getIssueTableFromFilterWithJql(DefaultIssueTableService.java:121)
com.atlassian.jira.plugin.issuenav.rest.IssueTableResource.getIssueTableHtml(IssueTableResource.java:99)
For this scenario, the thread meant for rendering the issue table view with the issue search result was stuck trying to get the value (com.xiplink.jira.git.jql.GitBranchCF.getValueFromIssue) for a custom field from a plugin to be displayed in the search result.
原因
For filters saved for JQL issue searches, you can utilize the columns button to configure the columns to be displayed in the search result. Please refer the section 'Changing the column configuration for your own filters' under configuring-the-default-issue-navigator. Users can configure the table columns that are visible to others, that run the filter by configuring the columns to be displayed under the filter section of the columns button. If this is set to the 'My defaults', it will display the columns that are based on the user account preferences.
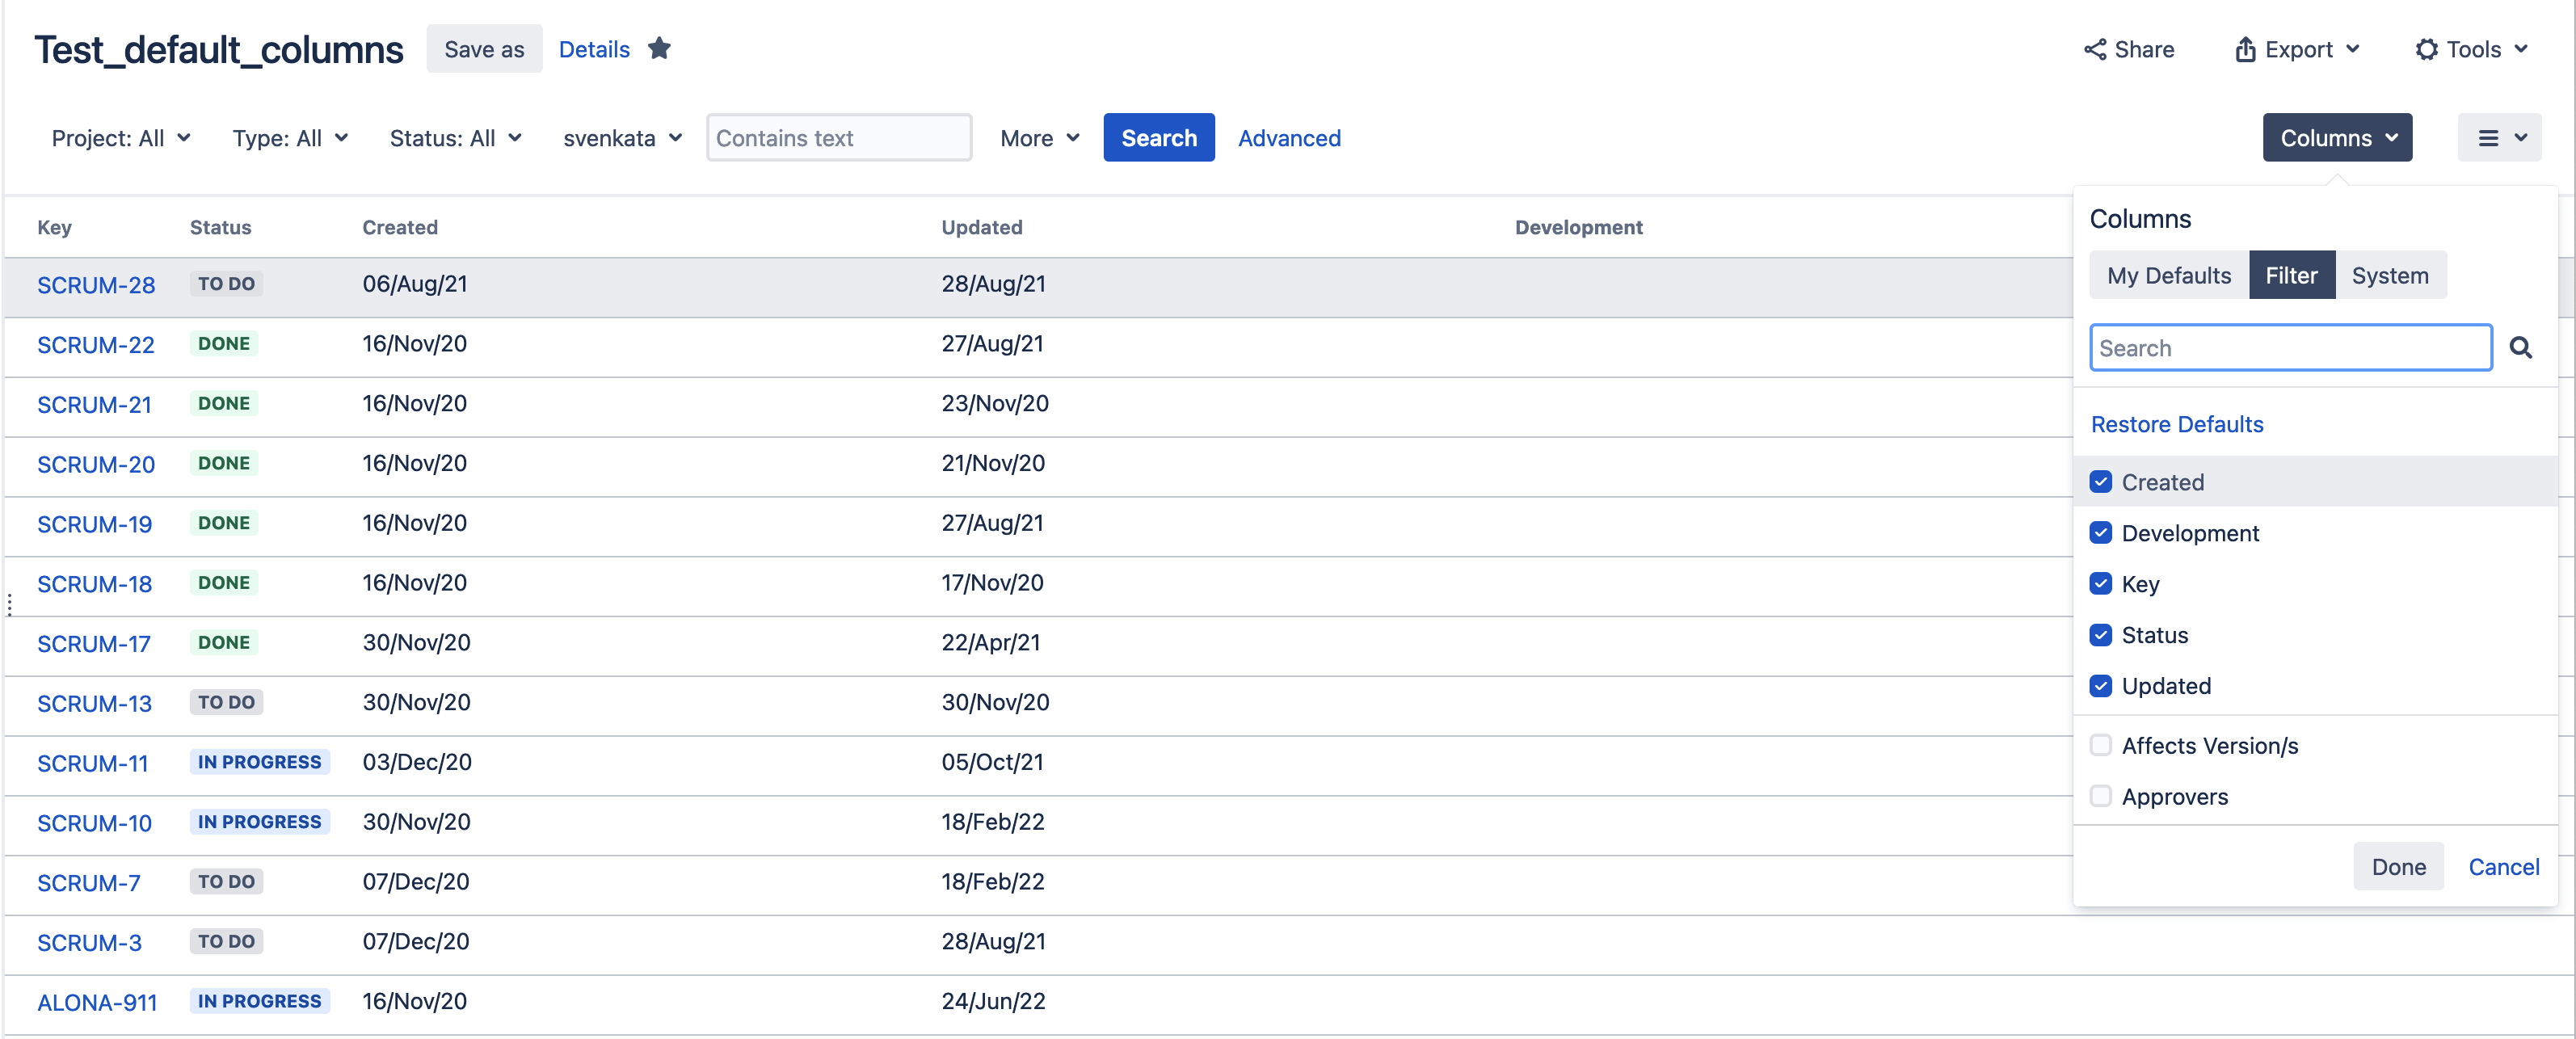
In this case, the specific user 'Athualpa' had chosen an additional column belonging to the custom field from a plugin to be shown under the My defaults section, whereas it was not selected in the filter section. The other users running this filter do not have the additional custom field column in the result set to be shown under their My defaults. The custom field was taking a lot of time to gather the values to load for this specific user.
ソリューション
Whenever there is a complaint about search results being slow to load for certain users, gather the artifacts mentioned in the Diagnosis section for two different users, with and without the problem. Then, verify where the delay is originating from. If it is related to a specific field, as shown in this case, then check the My defaults section of the filter for both users and the columns selected.
If the issue is found to be specific to a plugin, suggest raising a case with the plugin vendor for further analysis.
It's possible to track through the database which users or filters have the field configured to be displayed on issue navigator. For more details check the page below:
この内容はお役に立ちましたか?